Debugging JavaScript
This page describes how to debug Molybden application frontend written in JavaScript.
To debug the application frontend logic written in JavaScript we recommend that you use the built-in Chromium DevTools.
Debugging in DevTools
The Chromium DevTools is a powerful debugging tool that allows you to log messages, inspect JavaScript objects, and run JavaScript code in the context of your application.
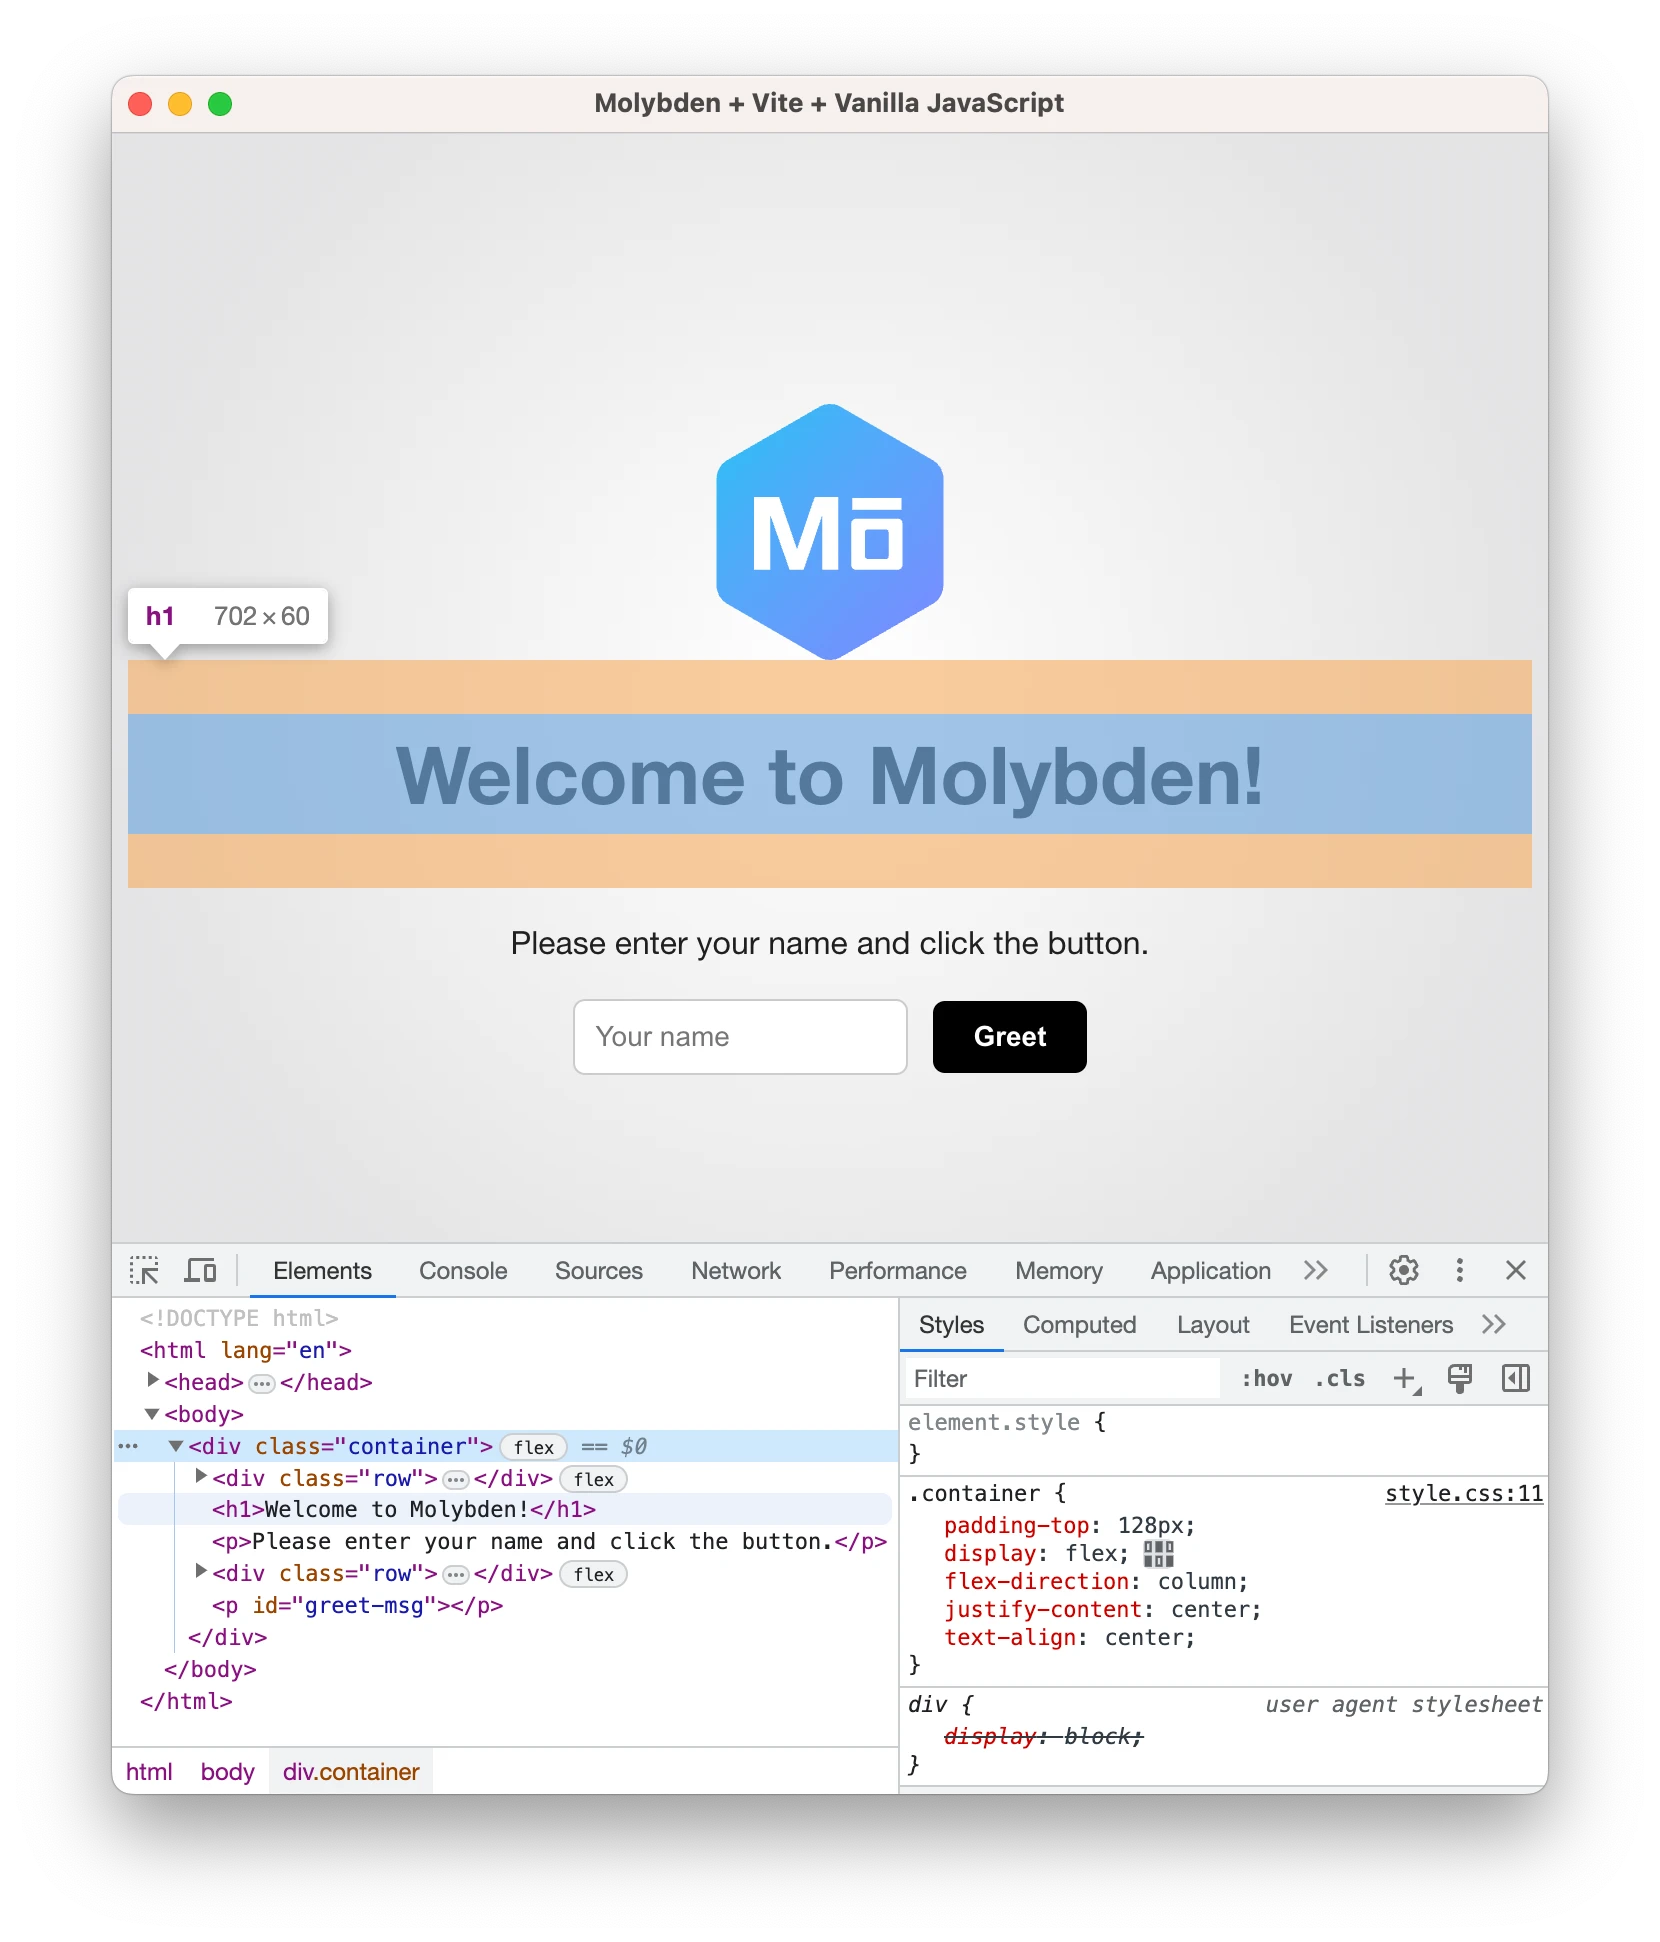
To toggle the DevTools window you can add the corresponding standard menu item to your application main or context menu and then use it, or you can programmatically show the DevTools window using the following code:
browser->devTools()->show();
You should see the following:
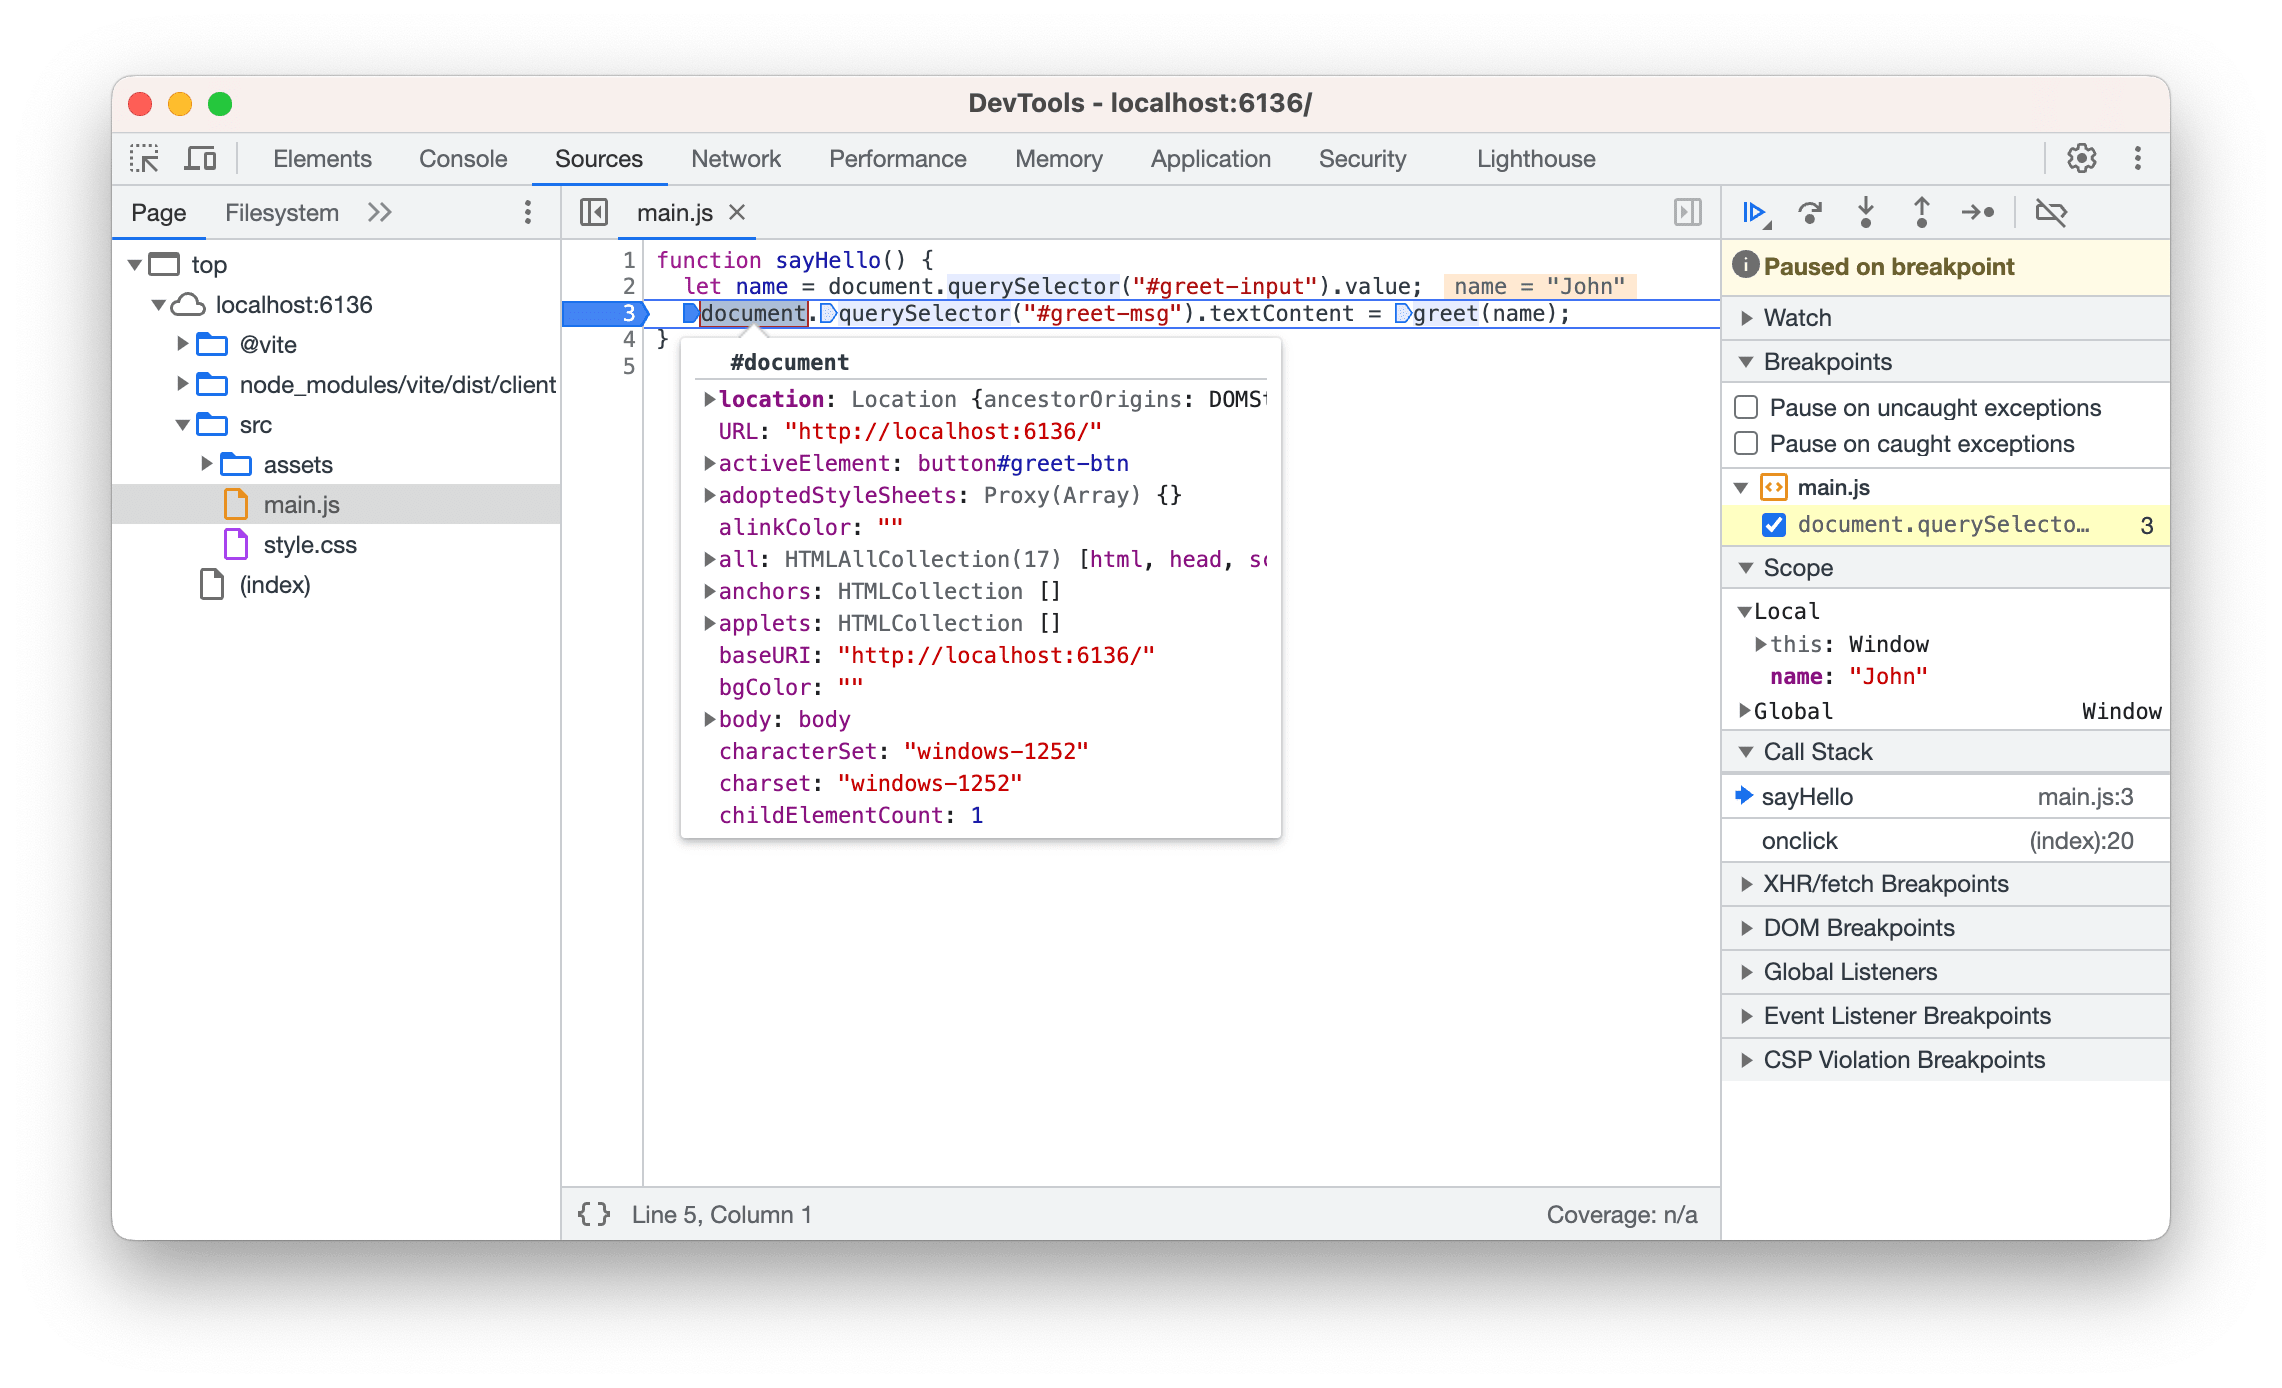
To debug JavaScript code in the DevTools window, open the Sources tab and select the JavaScript file you want to debug in the left sidebar. Then put breakpoints in the code by clicking the line number in the left sidebar.
Then reload content by pressing F5 or Ctrl+R on Windows and Linux and ⌘+Shift+R on macOS. Chromium DevTools will stop at the breakpoint:
Console
During debugging JavaScript code, you might want to use the Console API to write messages to the Chromium DevTools Console.
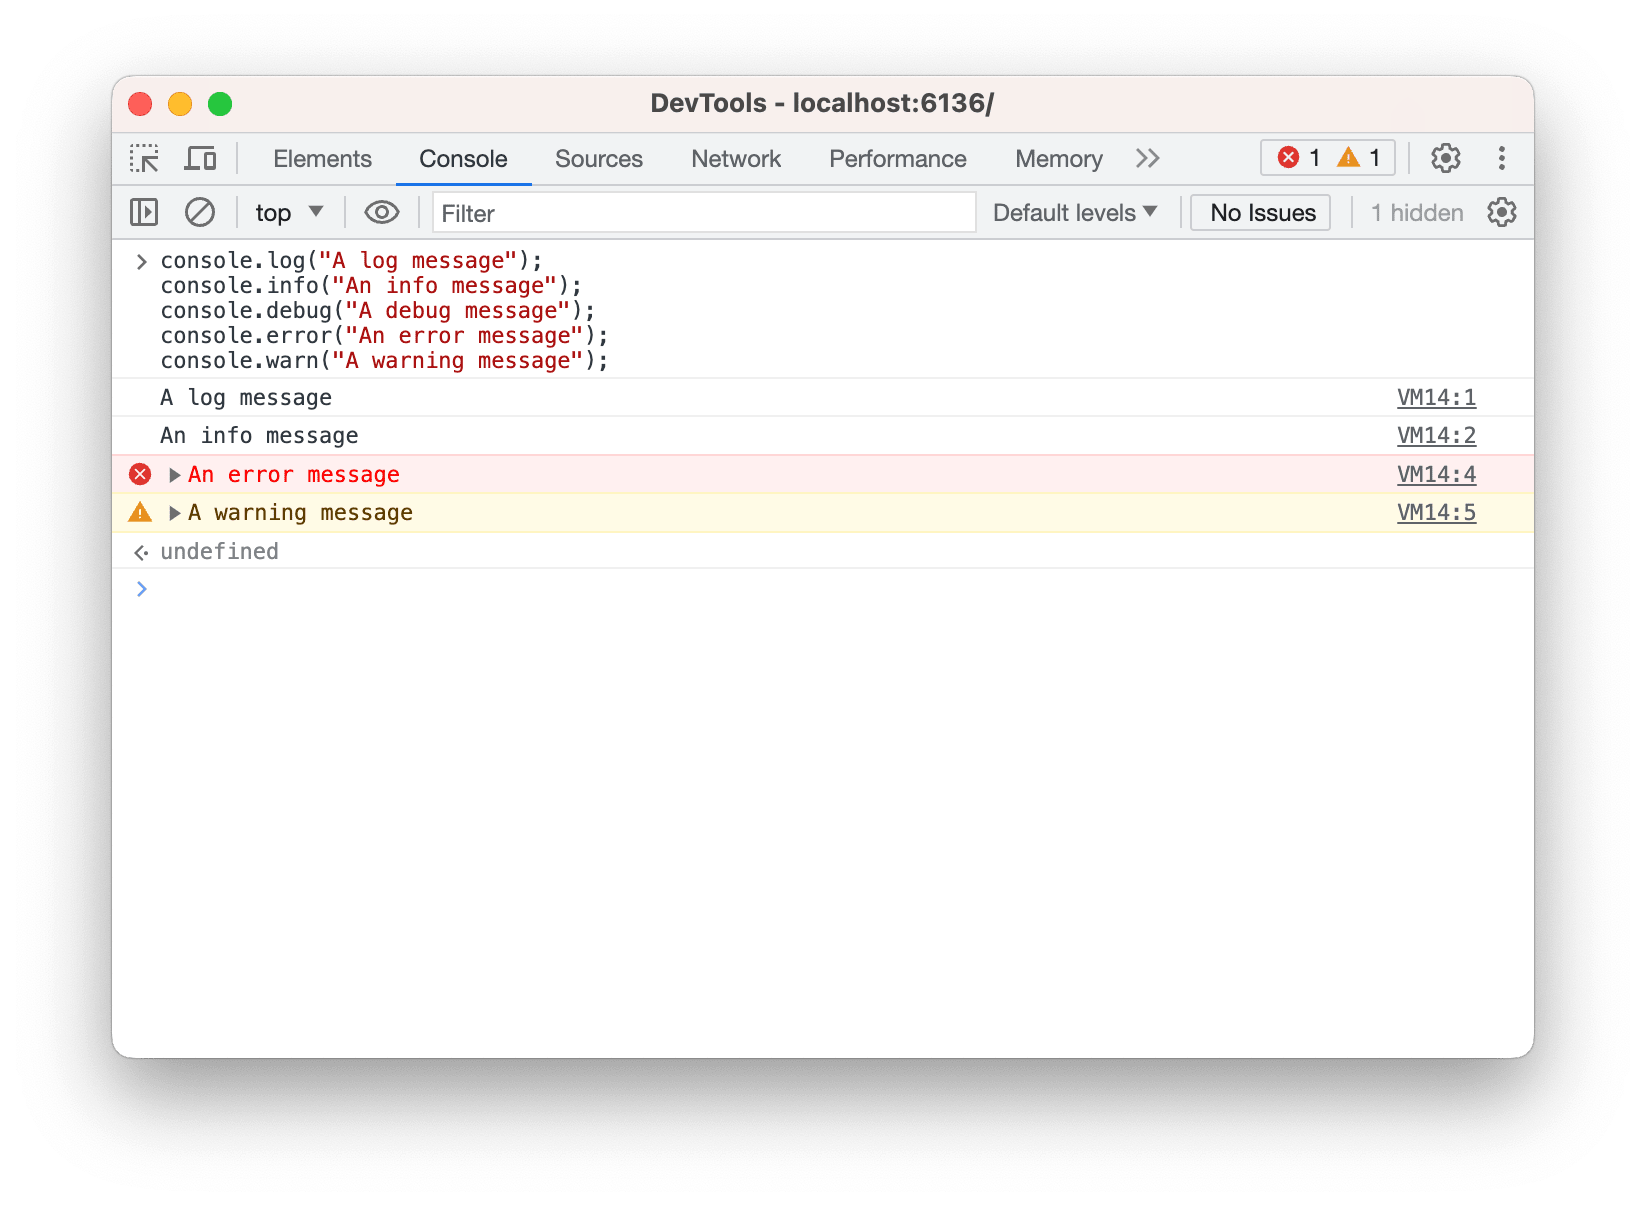
To log messages with different levels in JavaScript use the following approach:
console.log("A log message");
console.info("An info message");
console.debug("A debug message");
console.error("An error message");
console.warn("A warning message");
The messages will be displayed in the Chromium DevTools Console.
If you want to access the Console log messages from your application backend logic written in C++, you can use the following approach:
browser->onConsoleMessageReceived += [](const ConsoleMessageReceived& event) {
  std::string message = event.message;
  ConsoleMessageLevel level = event.level;
  uint64_t line_number = event.line_number;
};