Debugging C++
This page describes how to debug Molybden application backend written in C++ in your favorite IDE.
The application backend is written in C++. It is responsible for creating the application window, displaying native system dialogs, managing the application life cycle, making calls to the operating system and third party libraries, and communicating with the application JavaScript frontend.
To simplify the process of the application backend development and debugging, Molybden creates the CMakeLists.txt file in the project directory. You can open this file in your favorite C++ IDE that supports CMake projects and debug the application backend as a regular C++ application.
Debugging in Visual Studio
Microsoft Visual Studio is a powerful IDE for C++ development on Windows. It supports CMake projects and provides a convenient way to debug C++ applications.
To work with CMake projects, you need to install C++ CMake tools for Windows. It’s not installed by default.
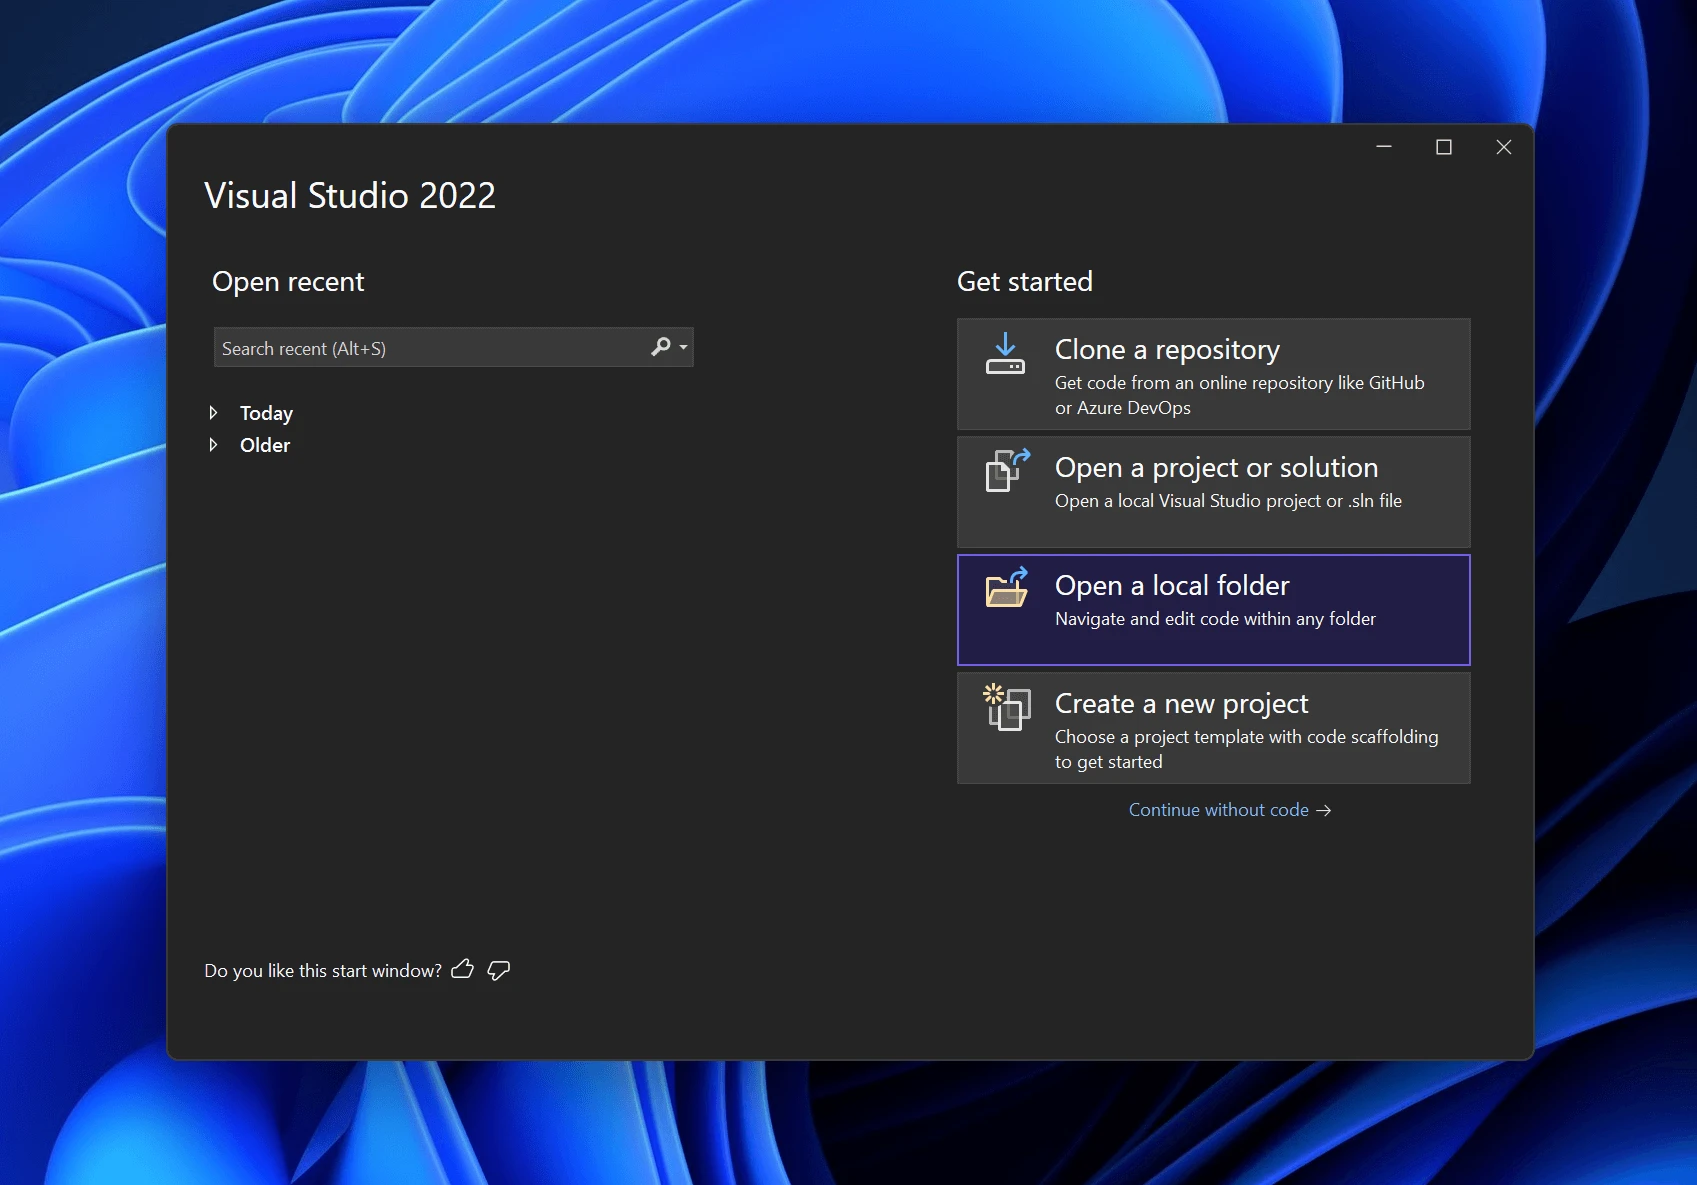
To open Molybden project in Visual Studio, just open the folder with your project as local folder.
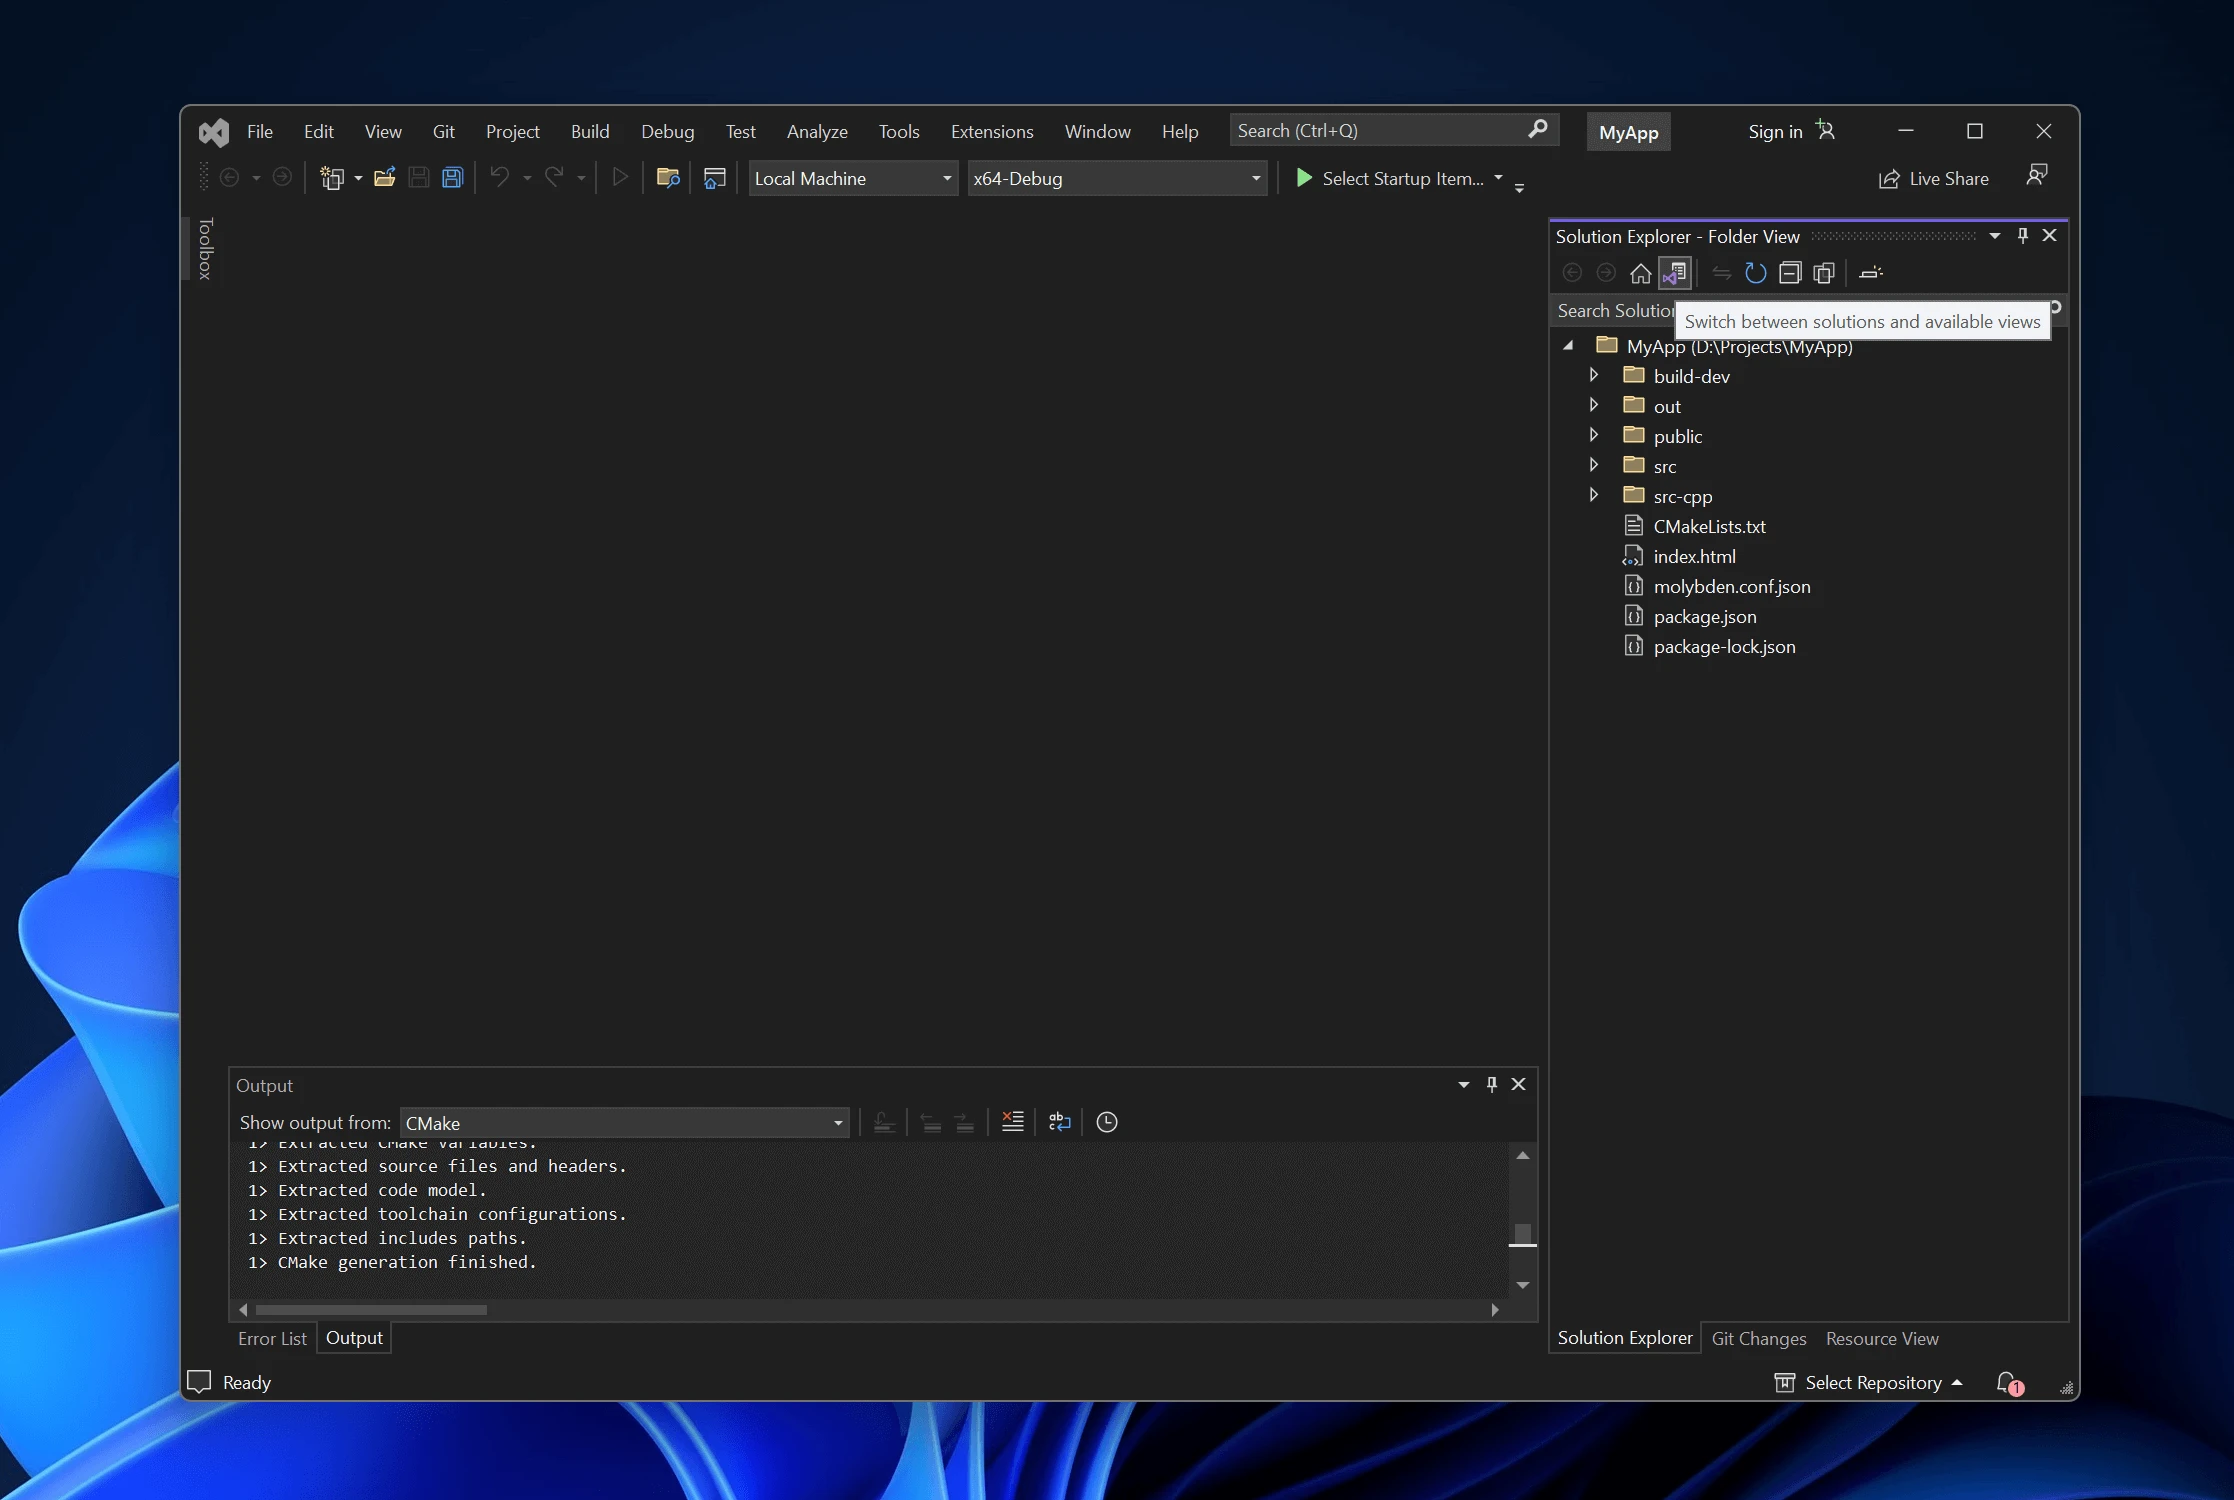
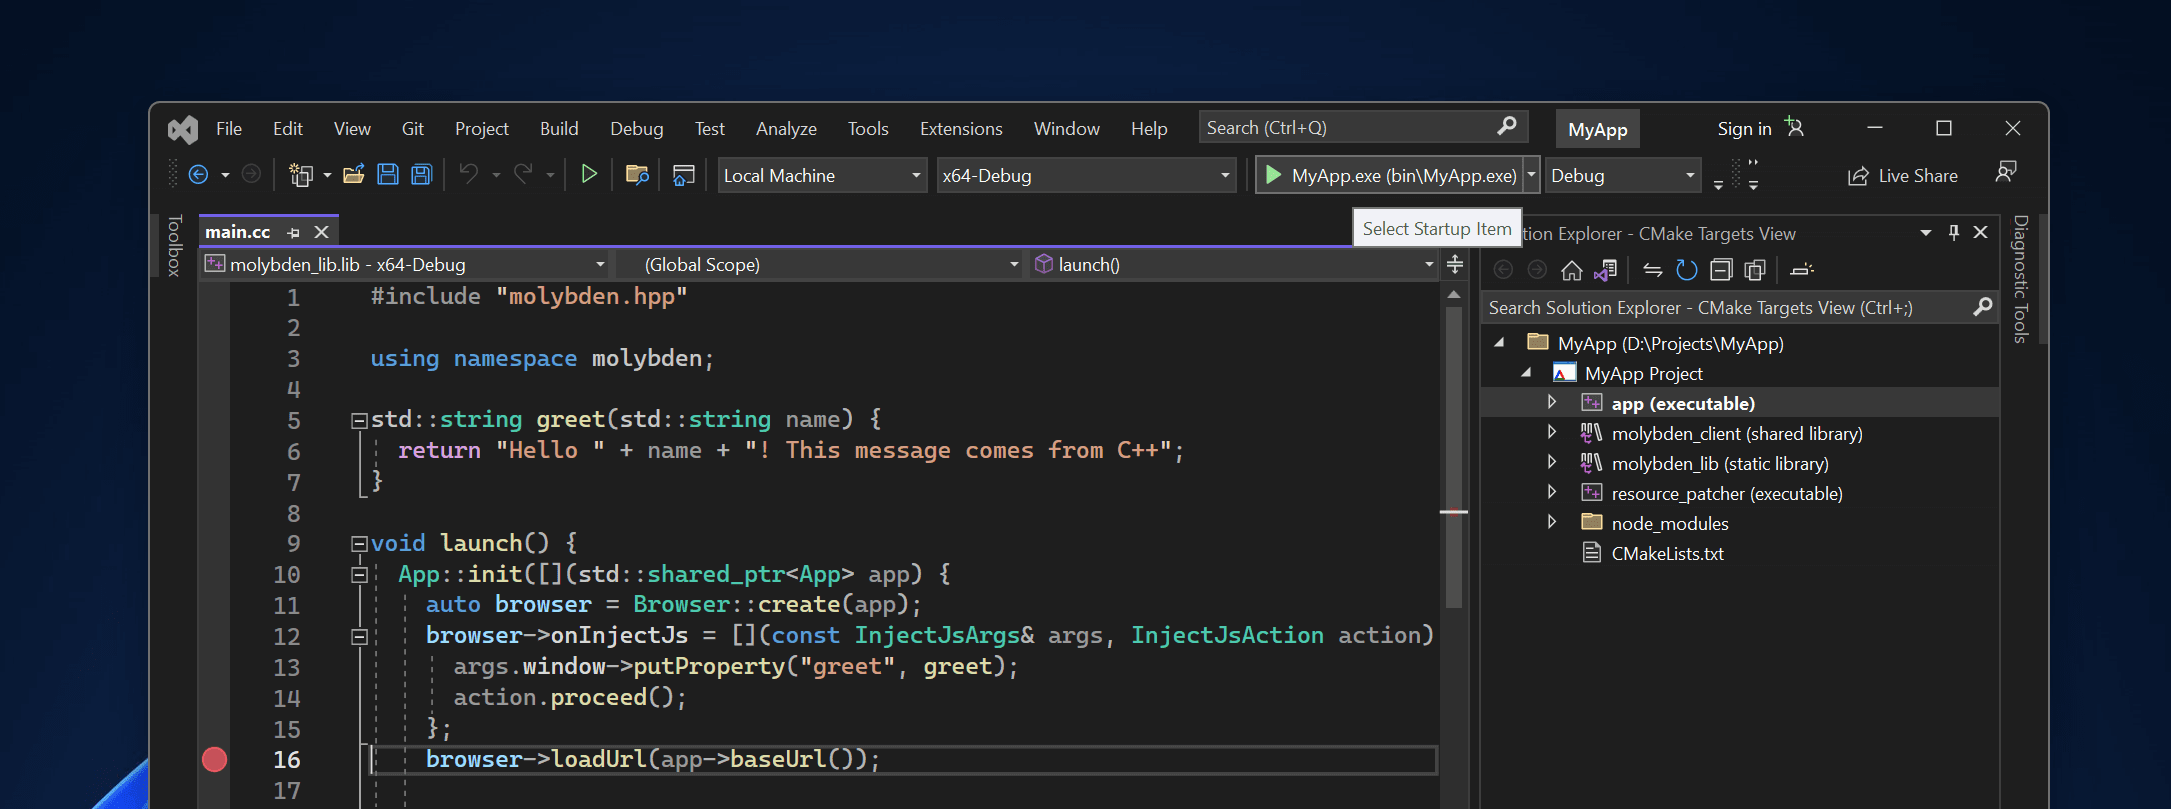
In the Solution Explorer window, click the Switch between solutions and available views toolbar button.
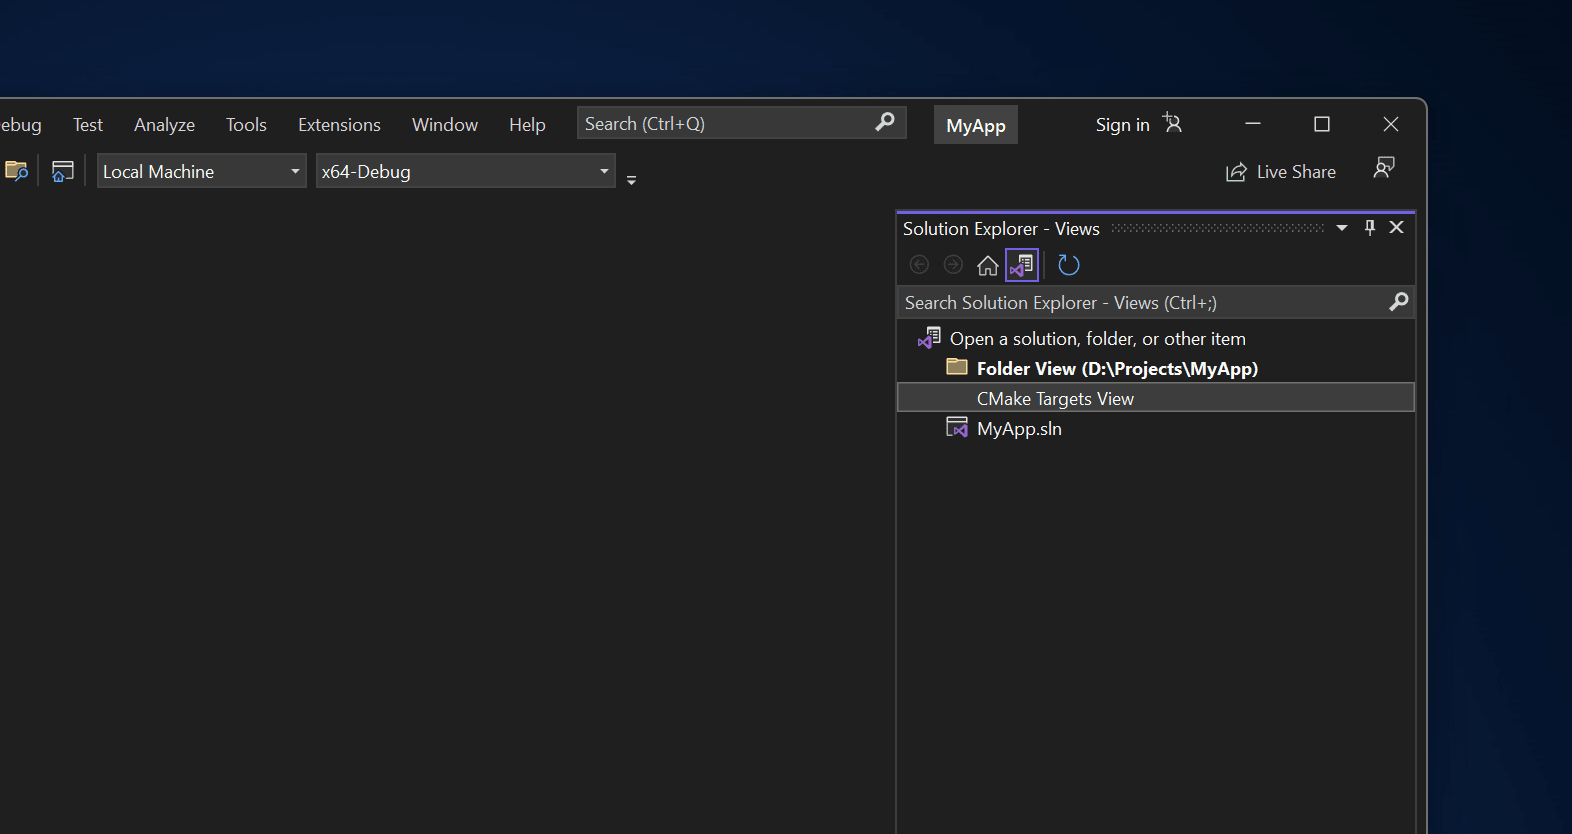
Select CMake Targets View.
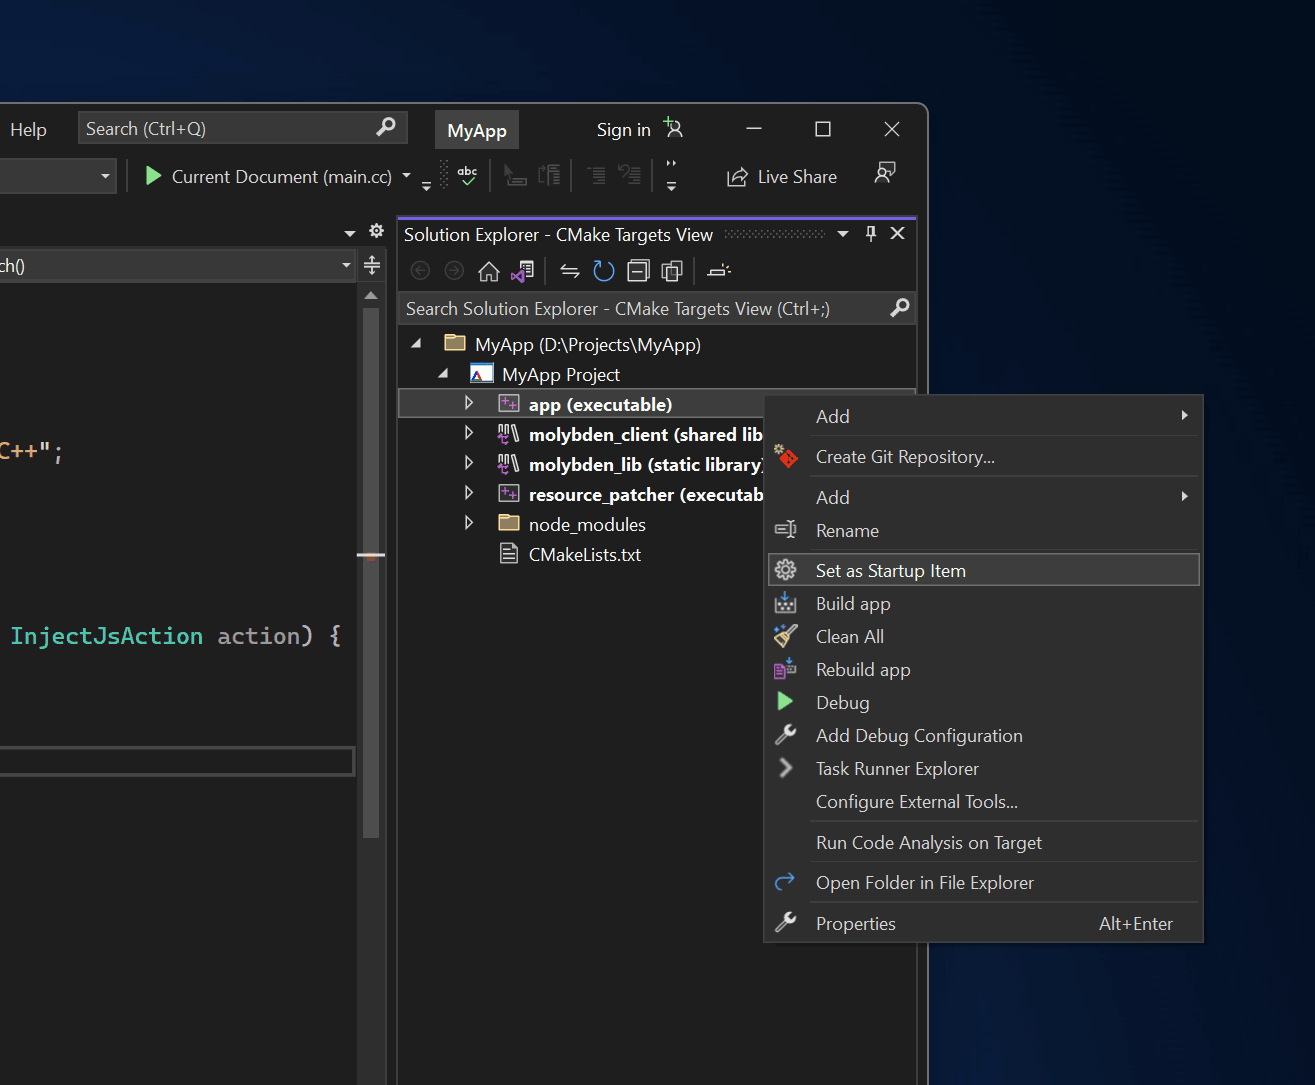
Set the app target as startup item.
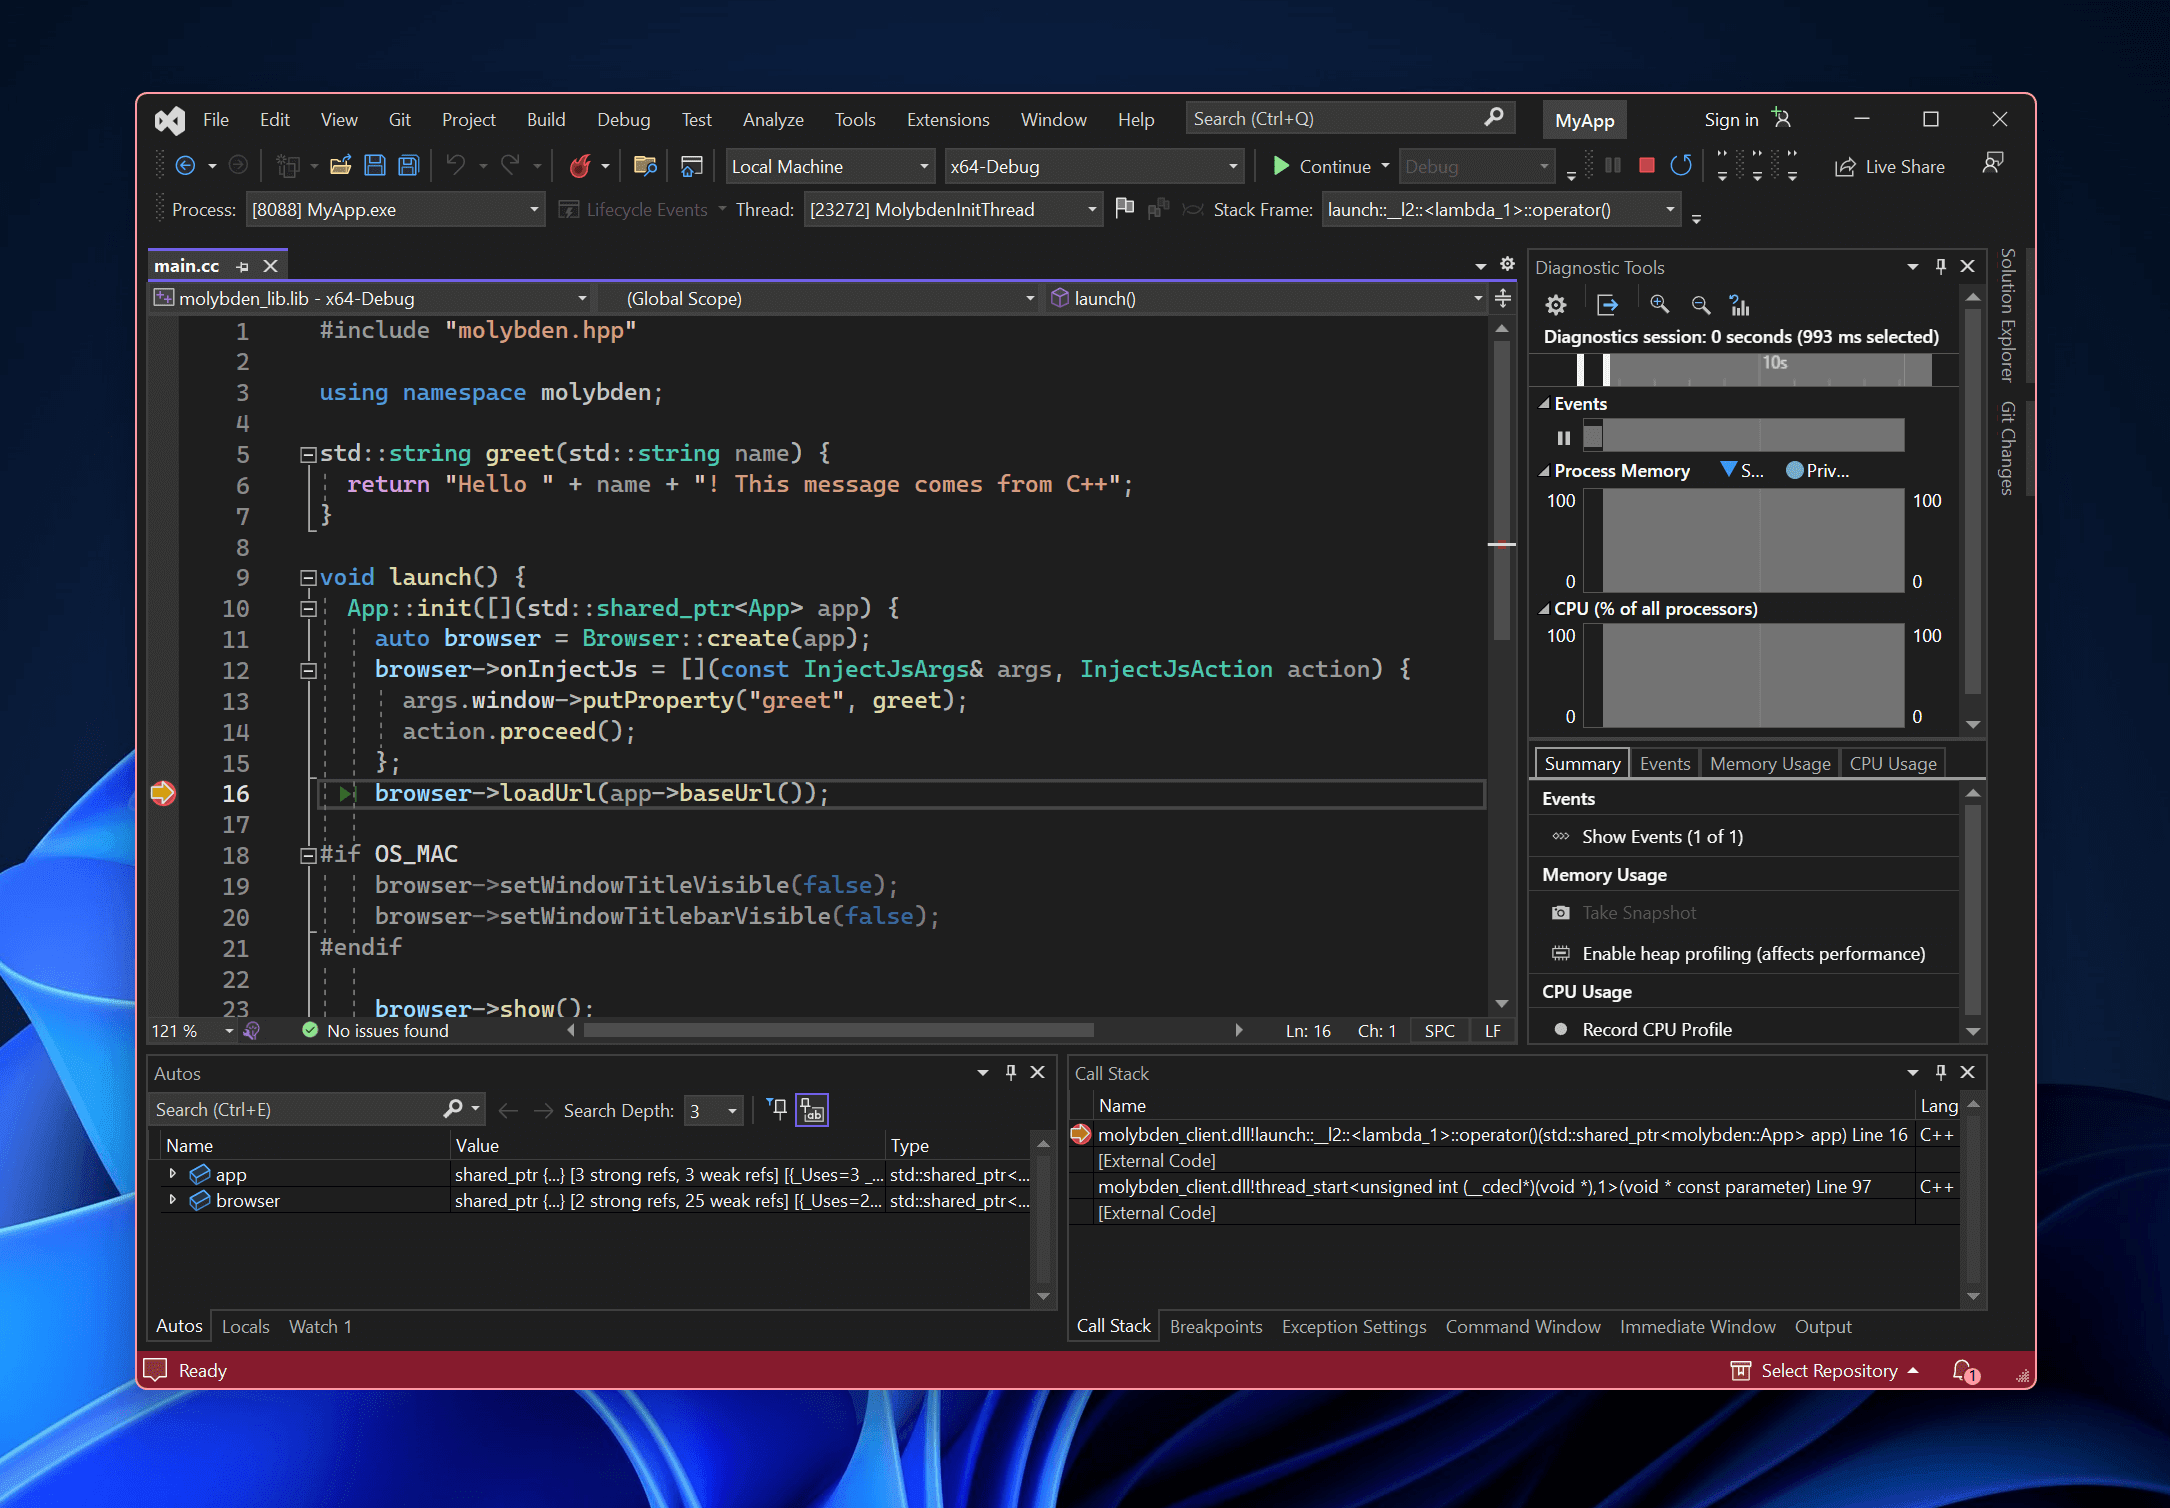
Now you can put breakpoints and debug your Molybden app by selecting the Debug configuration and clicking the Start button or pressing F5.
Visual Studio will build the application and start the debug session.
Debugging in CLion
CLion is a cross-platform C++ IDE developed by JetBrains. It supports CMake projects and provides a convenient way to debug C++ applications.
To start debugging the application backend in CLion, open the CMakeLists.txt file in CLion:
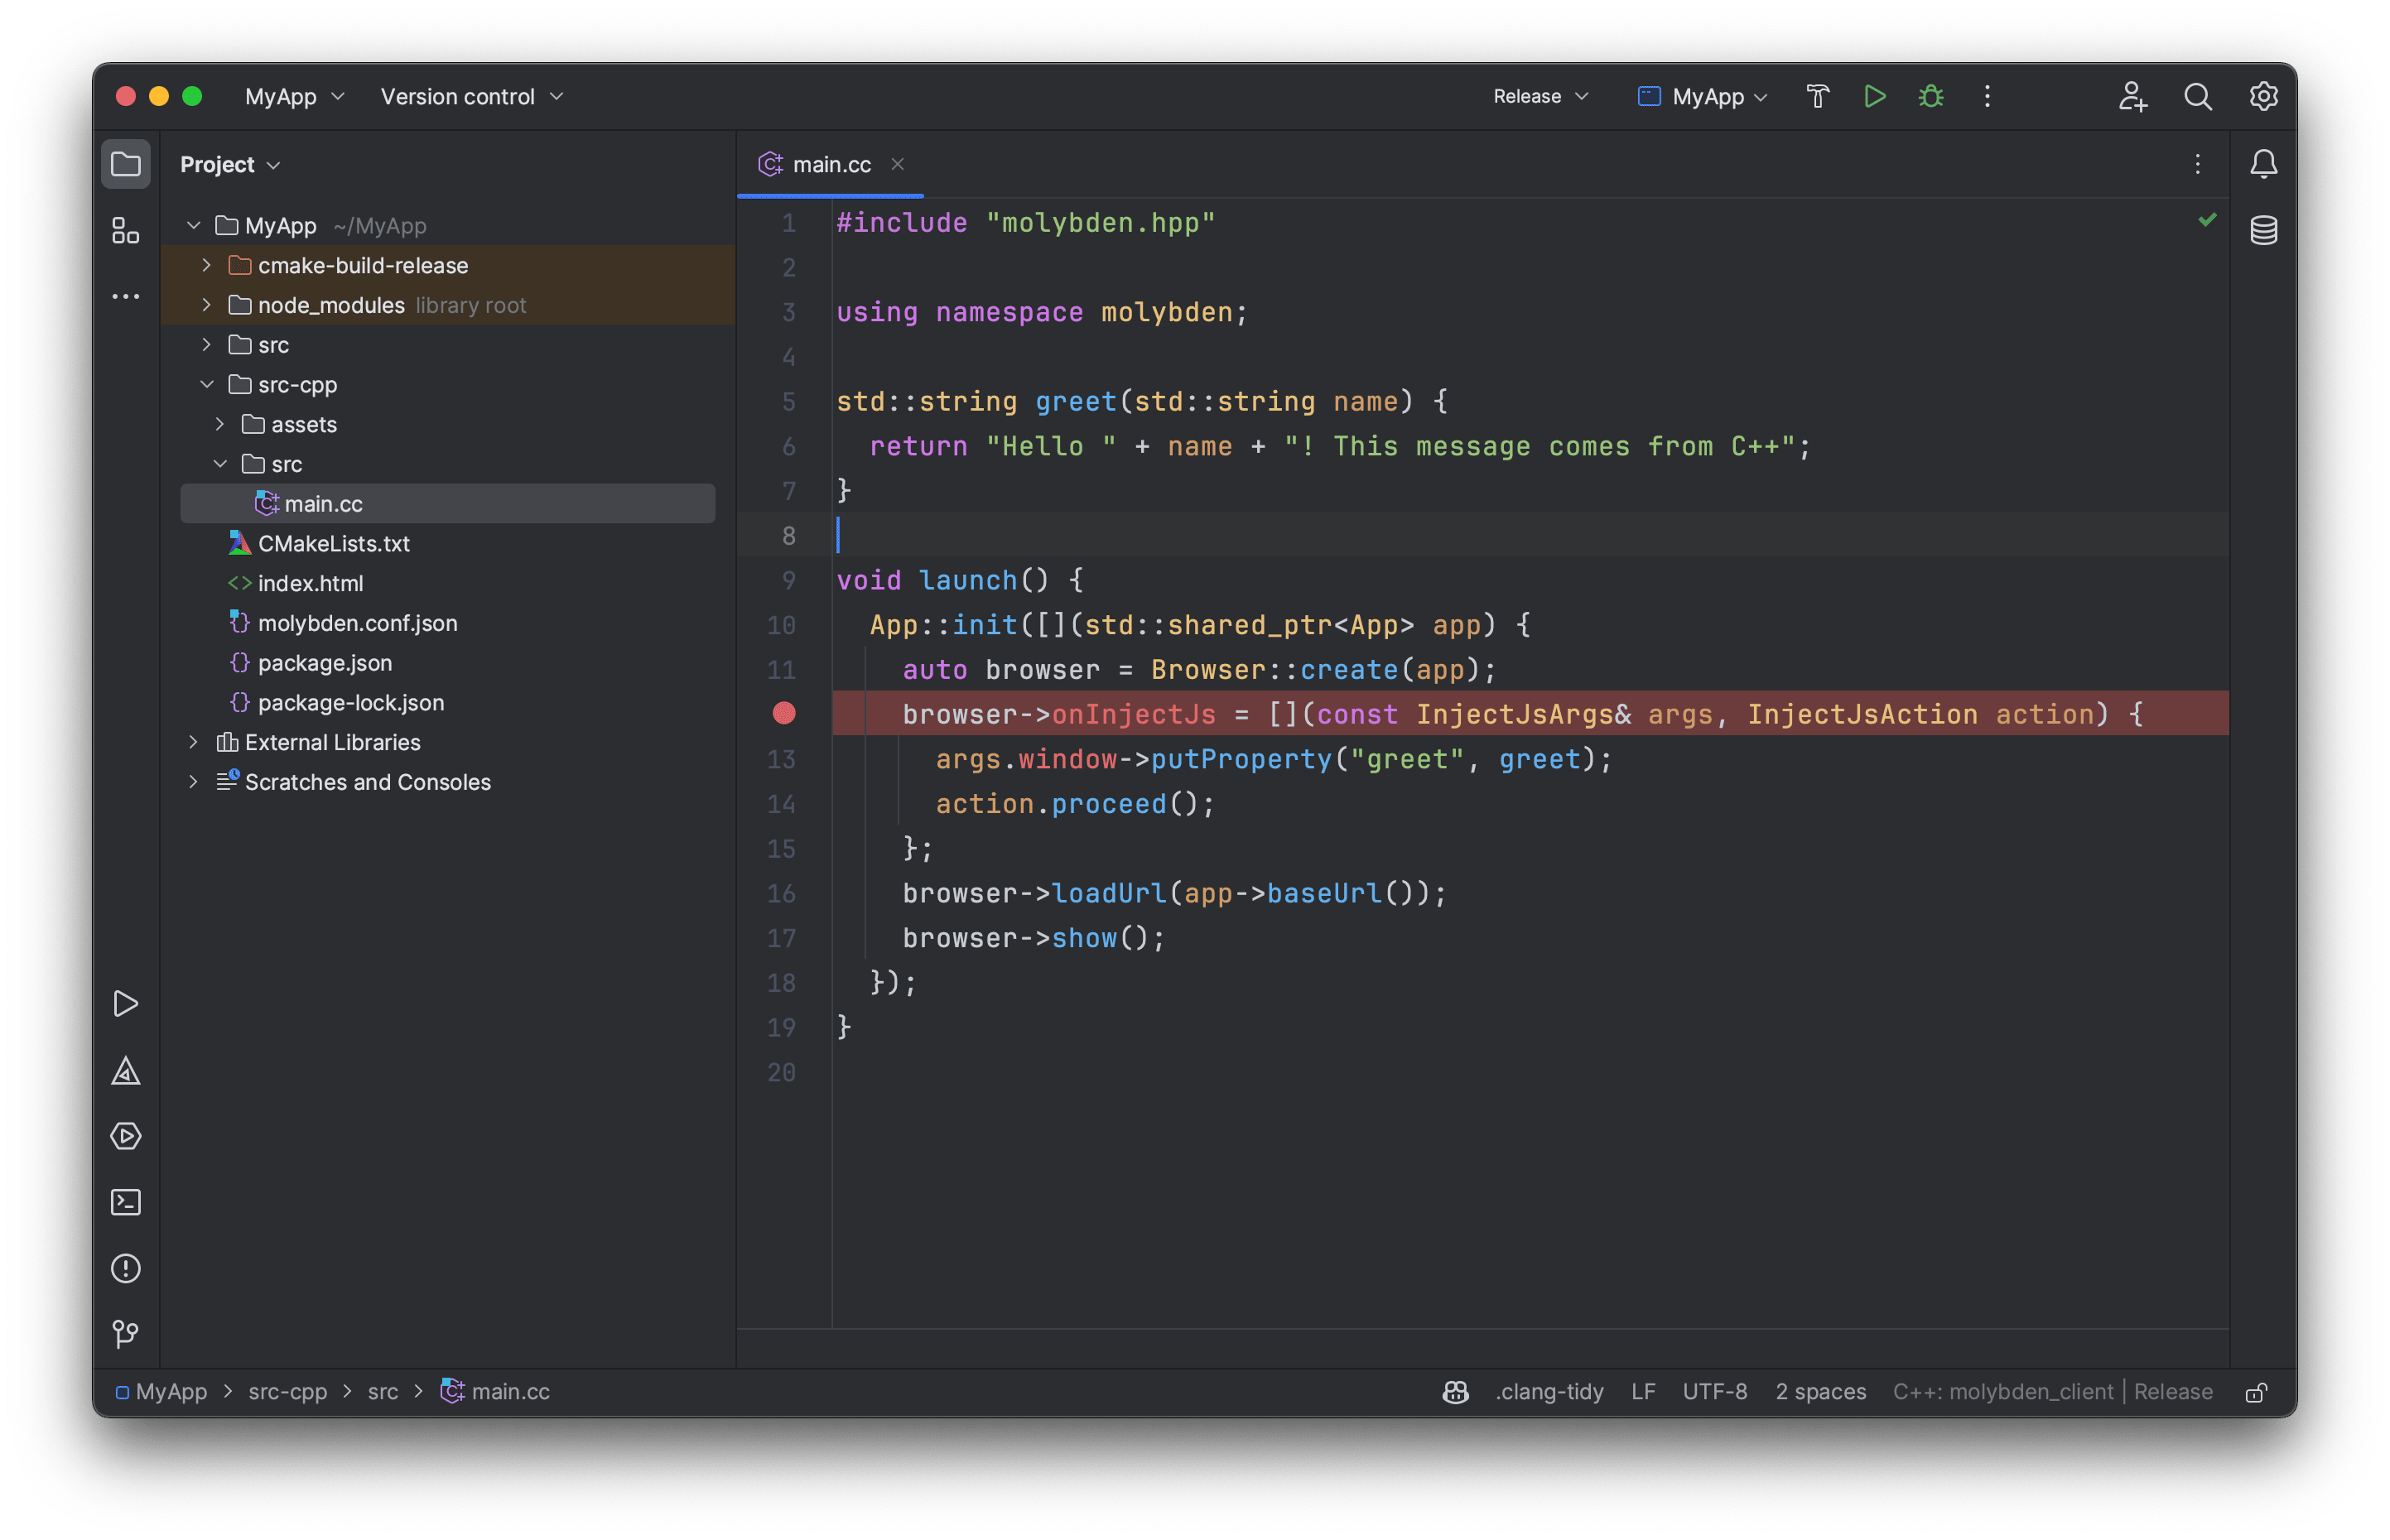
Open Settings → Build, Execution, Deployment → CMake and switch to the Debug build type:
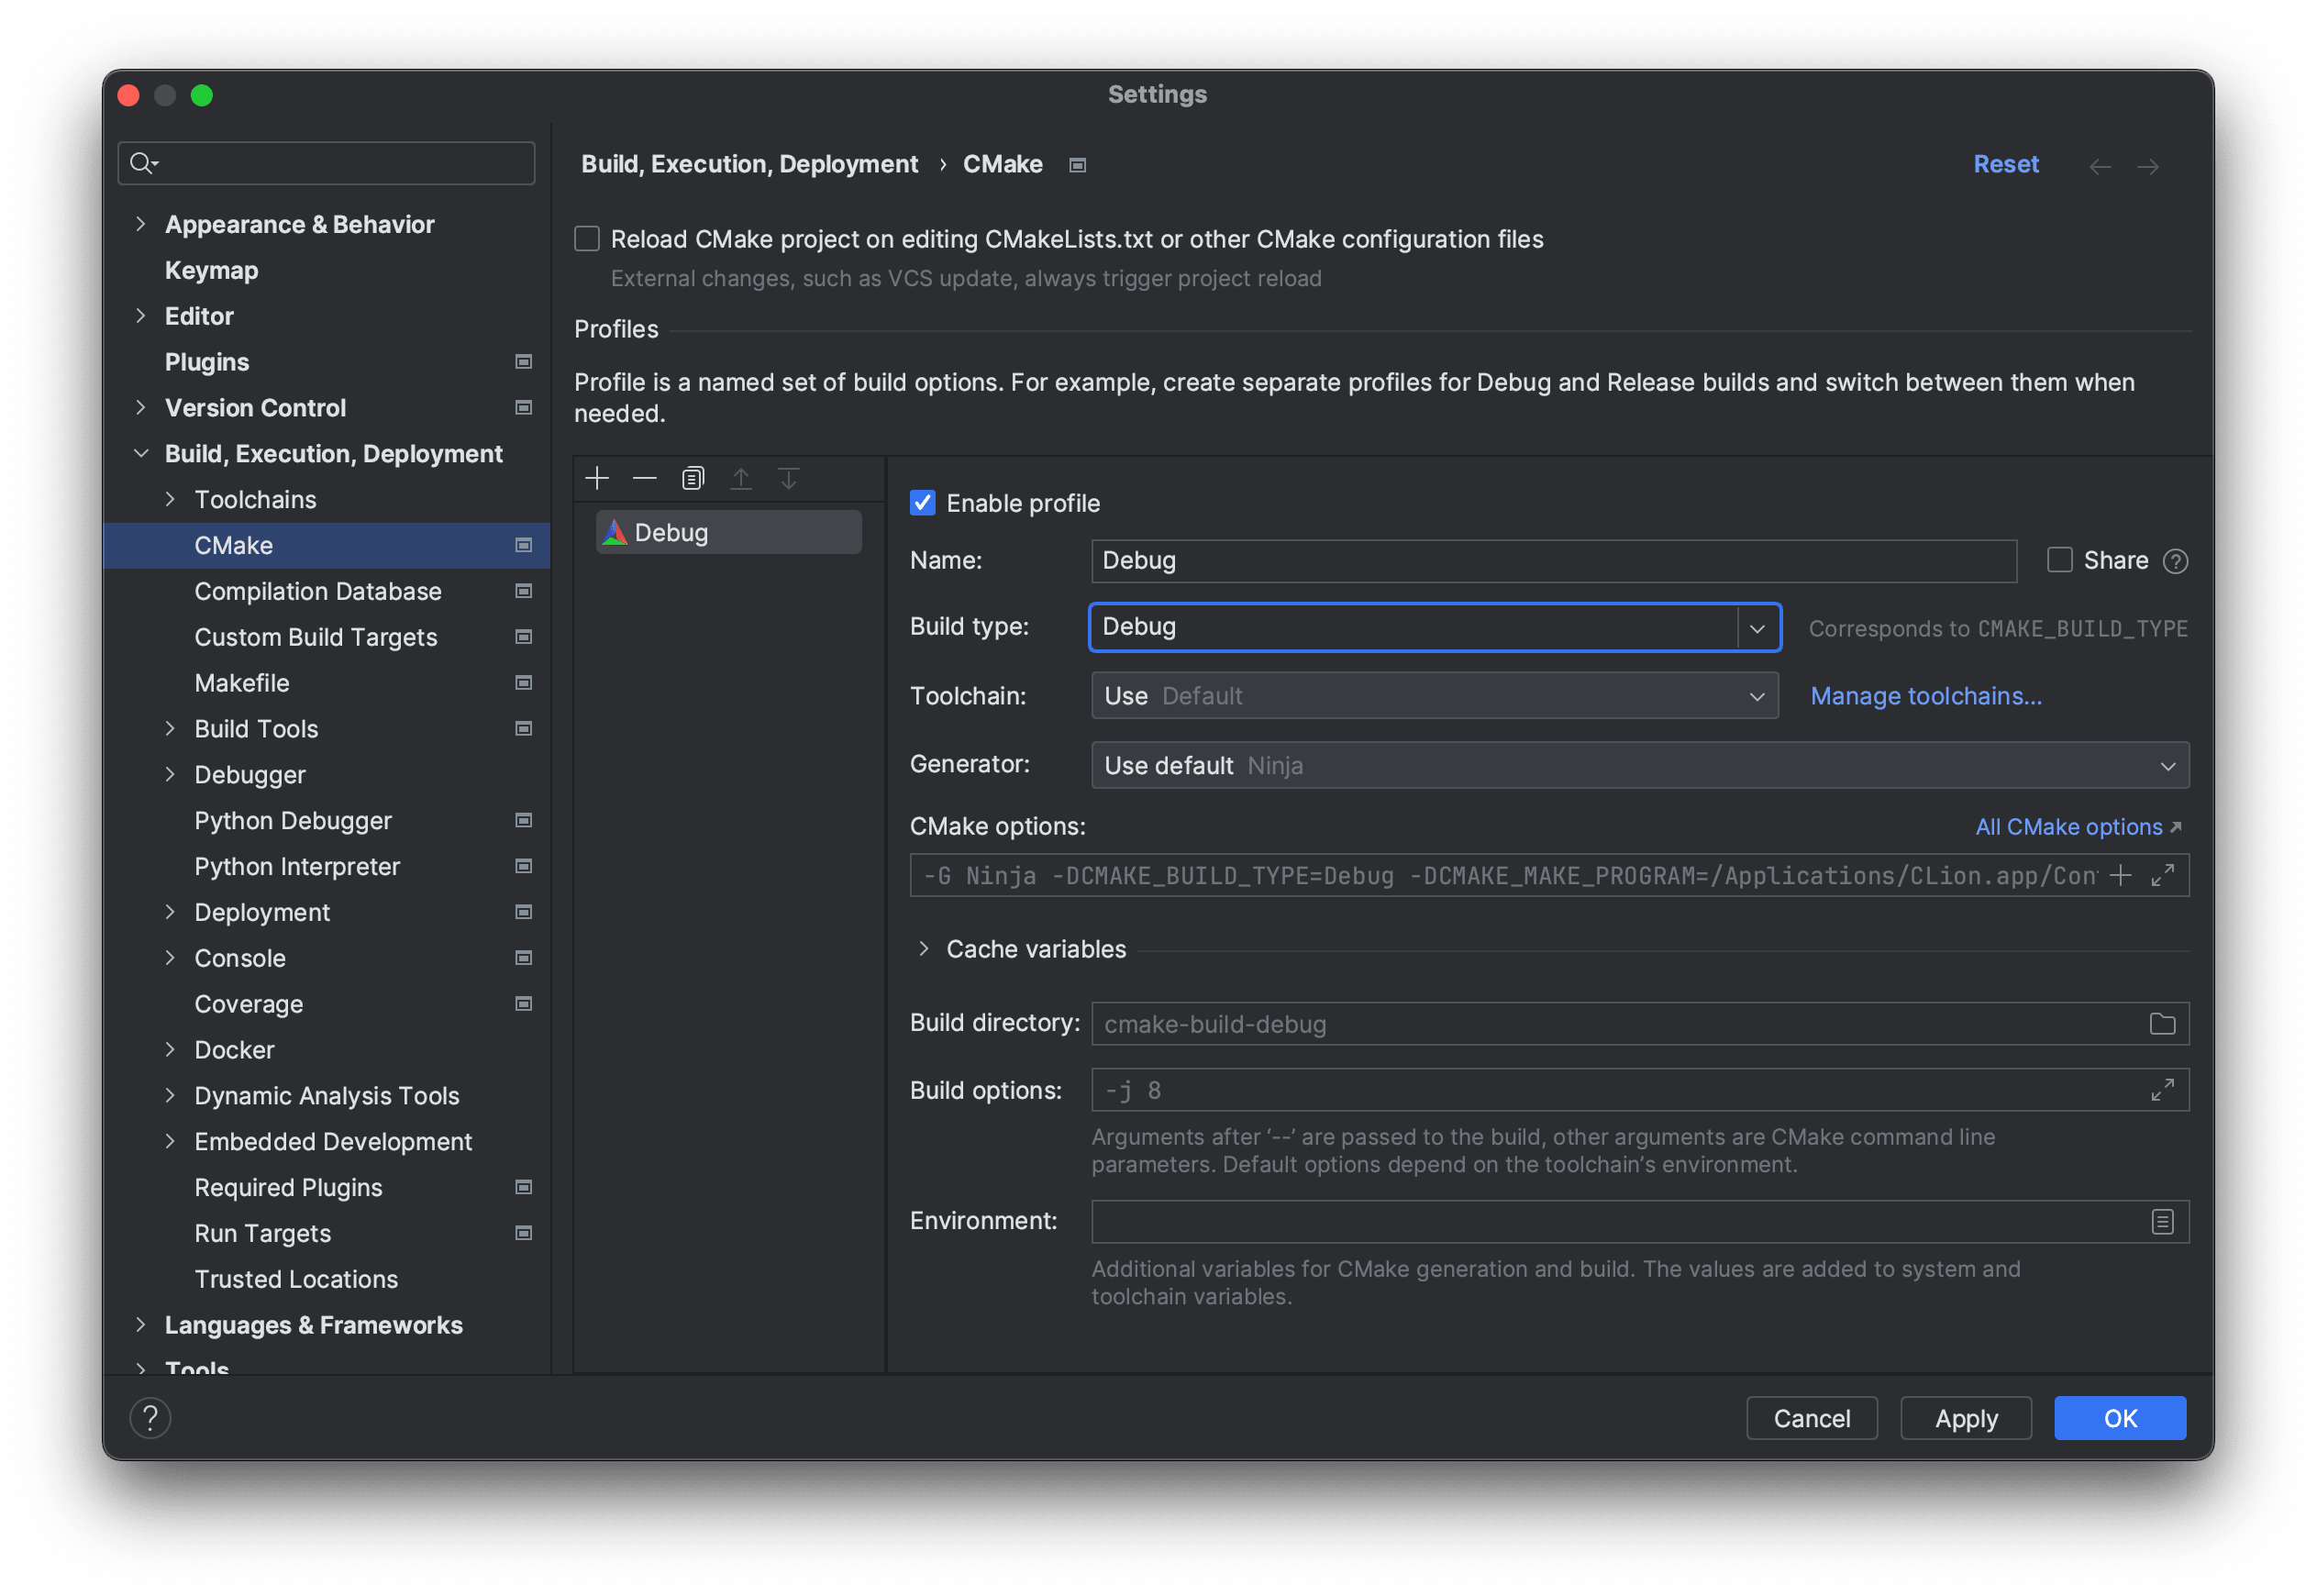
Click the Debug button in the top right corner of the IDE window.
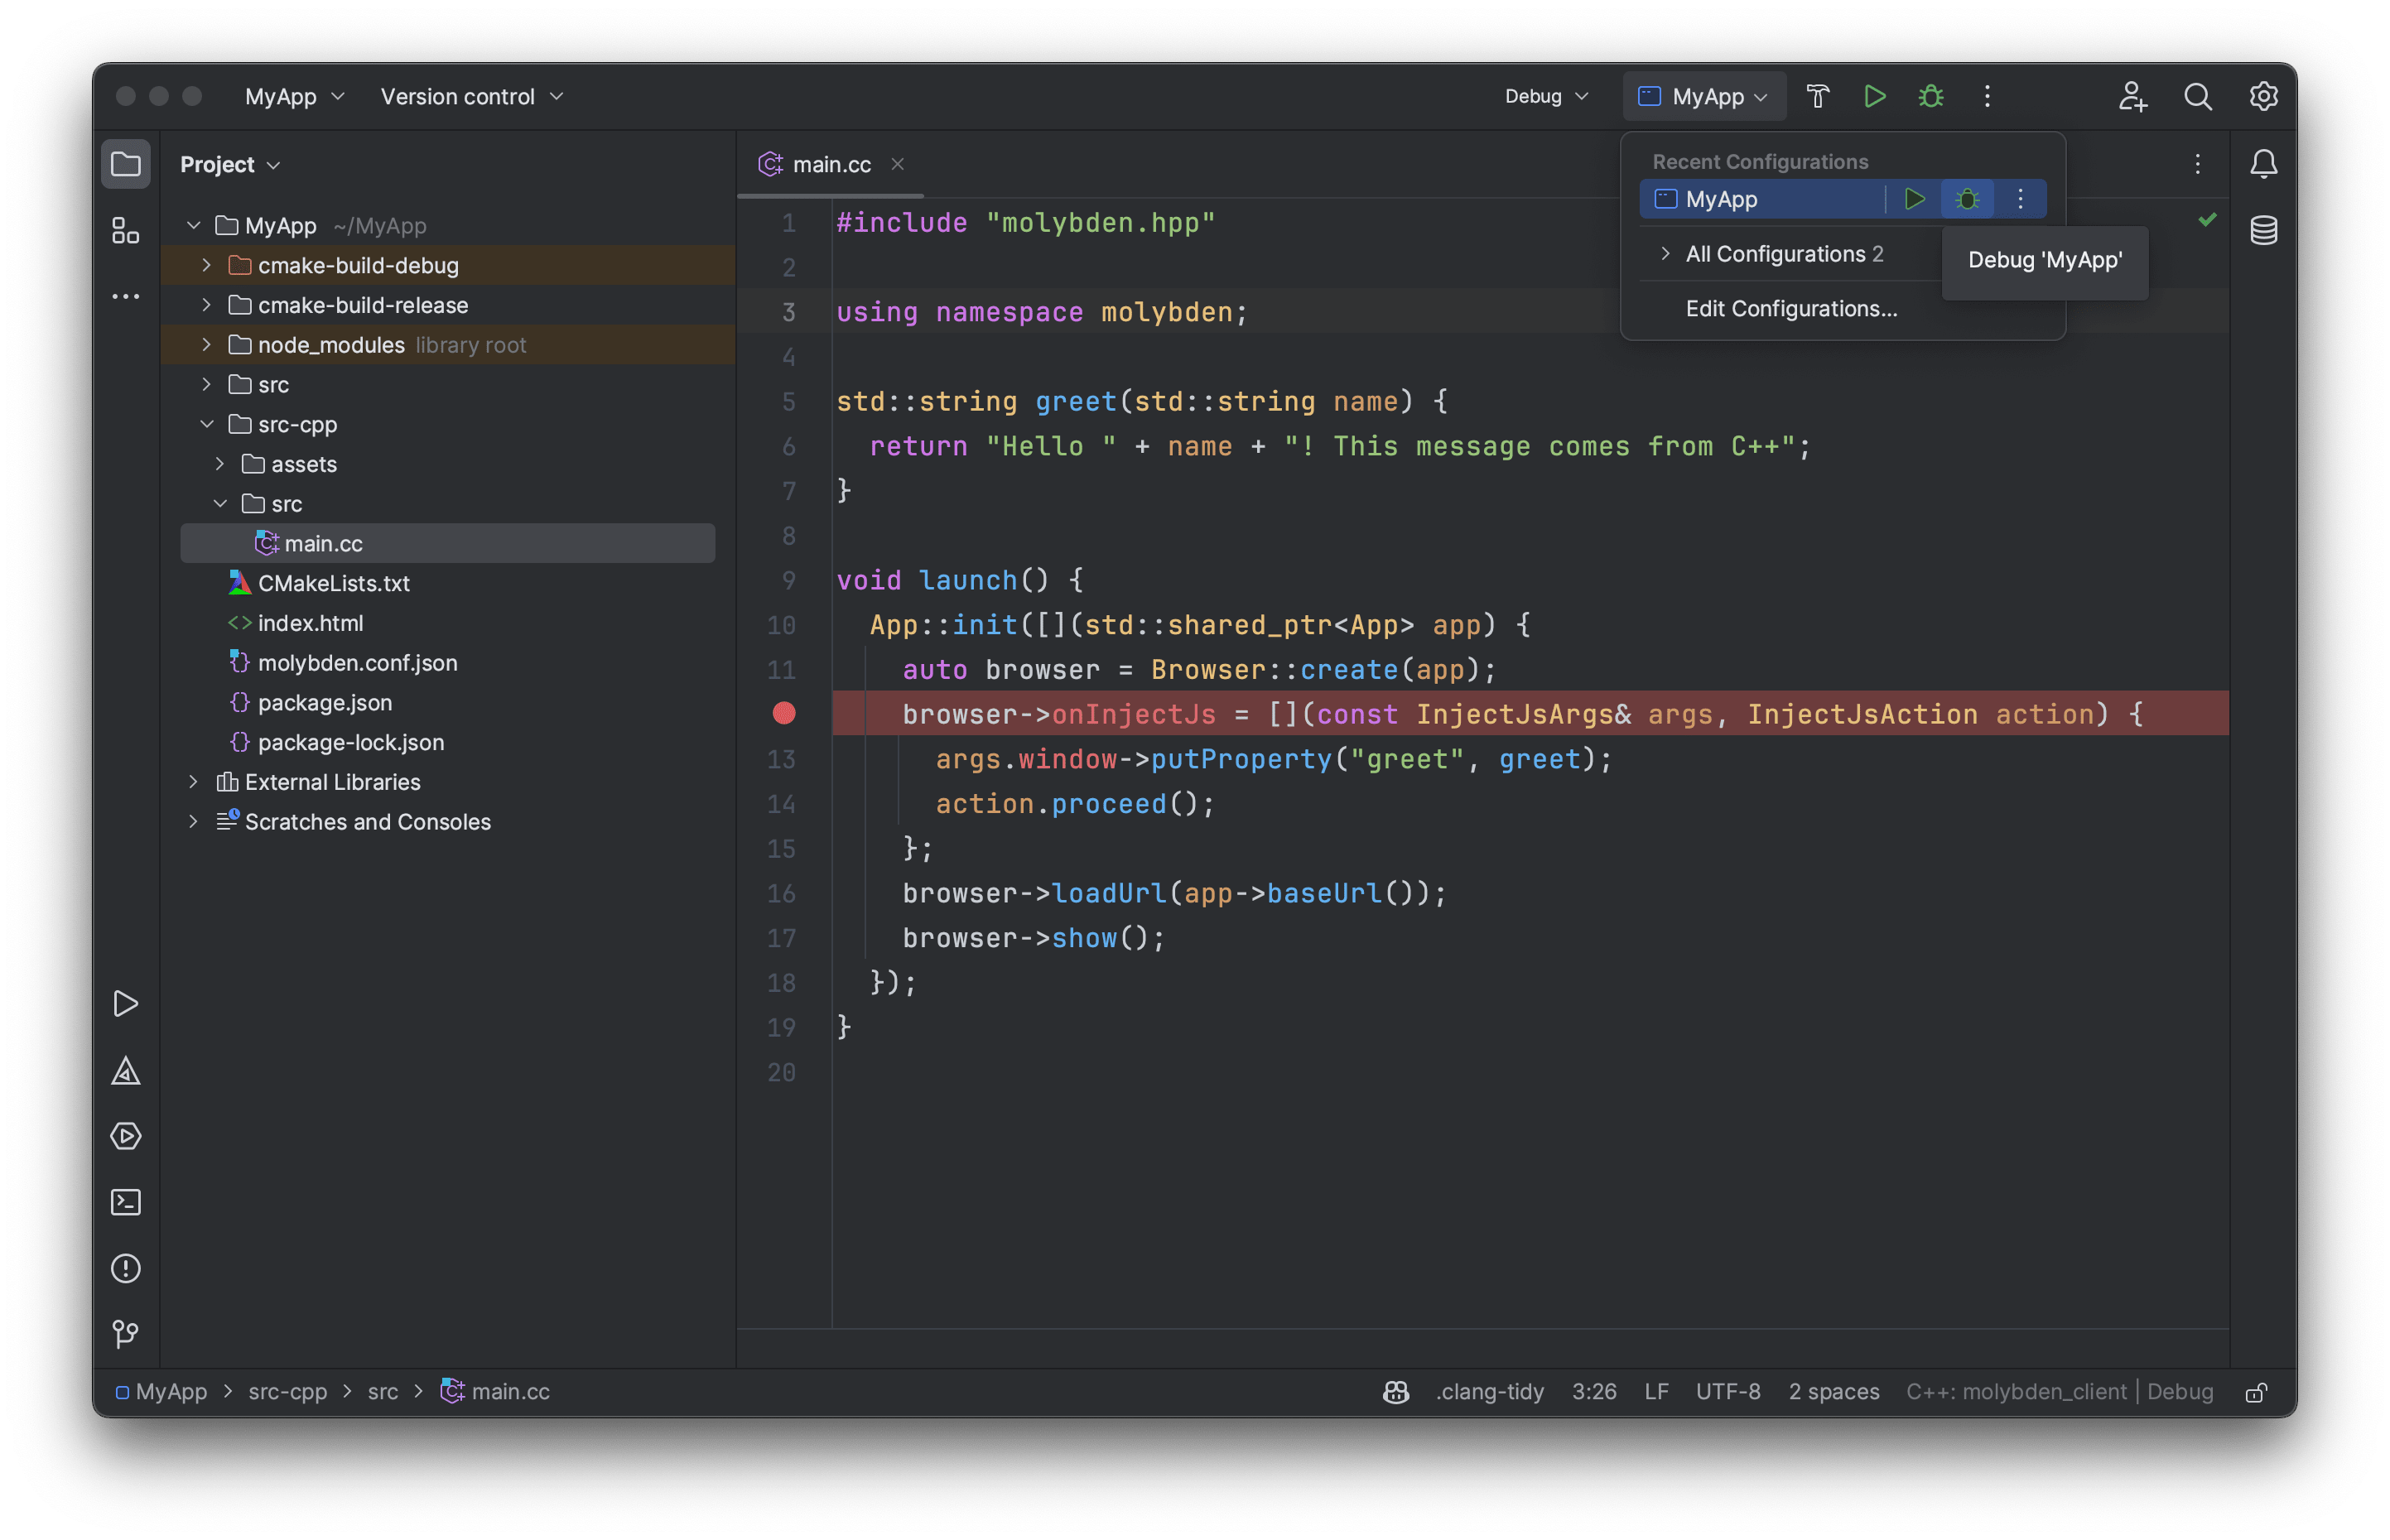
CLion will build the application backend and start the debug session.
Logging
During debugging, you might want to enable logging to access valuable information, track the flow of execution, identify potential issues, diagnose and fix problems more efficiently.
Molybden provides a flexible logging system that allows you to enable logging, specify the logging destination, and control the logging level.
You can use the logging system for the following debugging purposes:
- To log messages from your application code.
- To get log messages from Molybden internals.
Enabling logging
By default, logging is disabled to minimize overhead and improve performance in production environments.
To enable logging use the following approach:
#include "molybden.hpp"

using namespace molybden;

void launch() {
  AppOptions options;
  // Enable application logging.
  options.logging.enabled = true;
  App::init(options, [](std::shared_ptr<App> app) {
    // Create a new browser window.
  });
}
Logging levels
The logging system supports the following logging levels (see molybden::LogLevel):
| Level | Description |
|---|---|
kInfo |
Level used for informational messages. This is the most common severity level. |
kWarning |
Level used for warning messages. |
kError |
Level used for error messages. |
kFatal |
Level used for messages that indicate fatal errors that occur during the application lifecycle. The application will be terminated after a message with this level is logged. |
By default, the logging system logs messages with the kInfo level and higher. You can change the logging level using the following approach:
options.logging.log_level = molybden::LogLevel::kError;Pay attention to the kFatal level. If you enable logging with the kFatal level, the application will be terminated after a message with this level is logged.
Logging destinations
The log messages can be written to the application standard output or to a file.
Standard output
Once logging is enabled, log messages are directed to the standard output. The application will automatically display log messages in the console or terminal window where your application is running.
If you run the application as a regular GUI application that doesn’t display a console window with the standard output, you won’t see the log message. In this case we recommend that you log messages to a file.
Log file
To log messages to a file use the following approach:
options.logging.destination = molybden::Destination::kFile;
options.logging.log_file = "/Users/me/MyApp/molybden.log";
By directing logs to a file, you can store them for later analysis, share them with your team, or archive them for historical purposes.
Important: Ensure that the specified file path is accessible and has the necessary write permissions for successful logging.
Log messages
To log messages from your application code with the specified logging level use the following approach:
LOG(INFO) << "This is an informational message: " << data;
LOG(WARNING) << "This is a warning message: " << data;
LOG(ERROR) << "This is an error message: " << data;
LOG(FATAL) << "This is a fatal message: " << data;
The << operator supports the following types:
- C++ built-in types i.e,
int,float,double,char,bool, etc. -
std::string. -
void*, pointers to fundamental types, pointers to user-defined types, smart pointers.
To make a custom class or struct loggable, you must provide an appropriate << operator overload implementation. For example:
class MyClass {
 public:
  friend std::ostream& operator<<(std::ostream& os, const MyClass& myClass) {
    os << myClass.data_;
    return os;
  }

 private:
  int data_;
};
Privacy
The log messages include a lot of information required for debugging. All the sensitive information like login, passwords, keyboard and mouse events, dragged text, product license key, etc. is excluded from the Molybden log messages and replaced with asterisks (***).
Crash dumps
Molybden has a built-in crash reporting system that allows you to collect crash dumps and extract call stacks from them to identify the root cause of the crash.
All crash dumps are generated in the Windows-specific .dmp format and stored in a predefined location on the user’s machine:
%localappdata%\{app-name}\User Data\Crashpad
$HOME/Library/Application Support/{app-name}/Crashpad
$HOME/.config/{app-name}/Crash Reports
To extract and print a call stack from a .dmp file, you need the dump file itself and the symbols for the application
that generated this dump. You can run the following command from the root directory of your Molybden project to extract and print a call stack from a crash dump:
npm run molybden callstack -- -d path/to/file.dmp -s path/to/app/symbols/dir
By default, -s points to the build-dist/bin directory of your Molybden project.
Depending on platform, the application symbols are stored in different files:
The application symbols are stored in the molybden_client.dll.pdb file in the directory with application binaries, so -s is a path to the application binaries directory.
The application symbols are stored inside the {app-name}.app/Contents/Frameworks/Chromium Framework.framework/Libraries/libmolybden_client.dylib file,
-s is a path to the directory where the {app-name}.app file is located.
The application symbols are stored inside the libmolybden_client.so file in the directory with the application binaries, so -s is a path to the application binaries directory.
Important: to extract a call stack from a crash dump generated by a specific version of your application you need to have the application binaries and symbols of this version. So, please don’t forget to store somewhere the binaries and symbols of all application versions you distribute to your end users.
There may be cases when the crash comes from Chromium. In this case you will see the corresponding message in the console output during a call stack extraction. Please contact Molybden support team to get help with such crashes.