Renderer Process
This is where your application (frontend) user interface is rendered.
Overview
The renderer process is a Chromium process responsible for rendering the web content of a single browser window. Think of it as a browser tab: it runs your frontend JavaScript, HTML, and CSS, and has access to all standard browser APIs.
MōBrowser launches one renderer process for each browser window. Each renderer process is isolated from the others and from the main process.
When the browser window is closed, the corresponding renderer process terminates and releases all allocated memory.
Source code
The source code of your application frontend that is running in the renderer process is located in the src/renderer/ directory of your project.
.vscode/
assets/
resources/
src/
├── main/
├── renderer/
mobrowser.conf.json
package.json
tsconfig.json
tsconfig.node.json
vite.config.ts
Content of the directory depends on the frontend framework and UI component library you selected when creating the project.
Web technologies
The renderer process supports all standard web technologies. You can use any HTML, CSS, and JavaScript or TypeScript to build your frontend. Any frontend framework you selected when creating the project — React, Vue, or Vanilla — runs entirely inside the renderer process.
The renderer process has access to all standard browser APIs, including:
- DOM. Manipulate the document tree and respond to user events.
- Fetch API. Make HTTP requests to external servers.
- Web Storage. Persist data locally using
localStorageandsessionStorage. - Web Workers. Run background tasks in a separate thread without blocking the UI.
- WebGL. Render 2D and 3D graphics using the GPU.
Sandbox
Each renderer process runs in a Chromium sandbox that restricts direct access to the file system, operating system APIs, and Node.js modules. This isolation is a security feature: even if malicious code runs in your renderer process — for example, from a third-party library or a compromised dependency — it cannot access sensitive system resources without going through the main process.
If your frontend needs to perform a privileged operation such as reading a file or accessing the clipboard, it must send a message to the main process via IPC.
IPC with the main process
When the renderer process needs to perform an operation that is restricted by the sandbox — such as reading a file, accessing the clipboard, or calling a native API — it sends a message to the main process via IPC (Inter-Process Communication). The main process handles the request and sends a response back.
Read more about IPCDebugging
You can debug JavaScript code that is running in the renderer process using Visual Studio Code debugger or Chromium DevTools.
MōBrowser provides a project scaffolding tool that helps you create a new project from scratch. Each generated project is compatible with Visual Studio Code debugger and includes the .vscode/launch.json file that allows you to debug the source code that is running in the renderer process.
Visual Studio Code
MōBrowser provides a project scaffolding tool that helps you create a new project from scratch. Each generated project is compatible with Visual Studio Code debugger and includes the .vscode/launch.json file that allows you to debug the source code that is running in the renderer process.
To debug JavaScript in the renderer process:
Open the project directory in Visual Studio Code or any other VS Code-based IDE such as Cursor or Google Antigravity and set the breakpoints in src/renderer/App.tsx.
Click the Debug button in the VS Code toolbar to open the Debug panel and select the Debug All configuration.
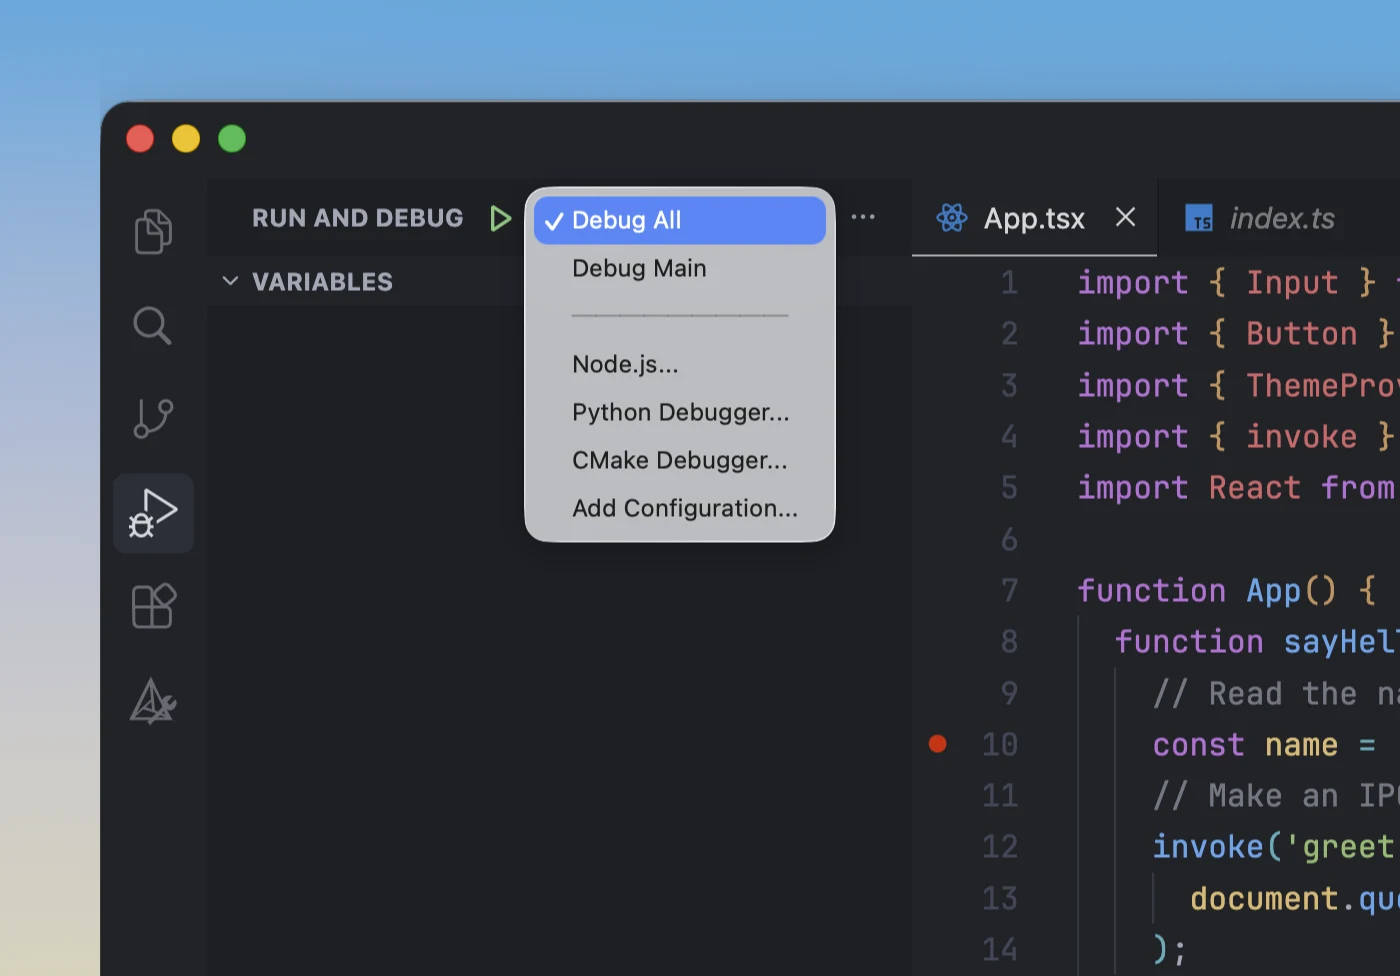
Start the debugging session by pressing F5 or by clicking the Debug button in the VS Code toolbar.
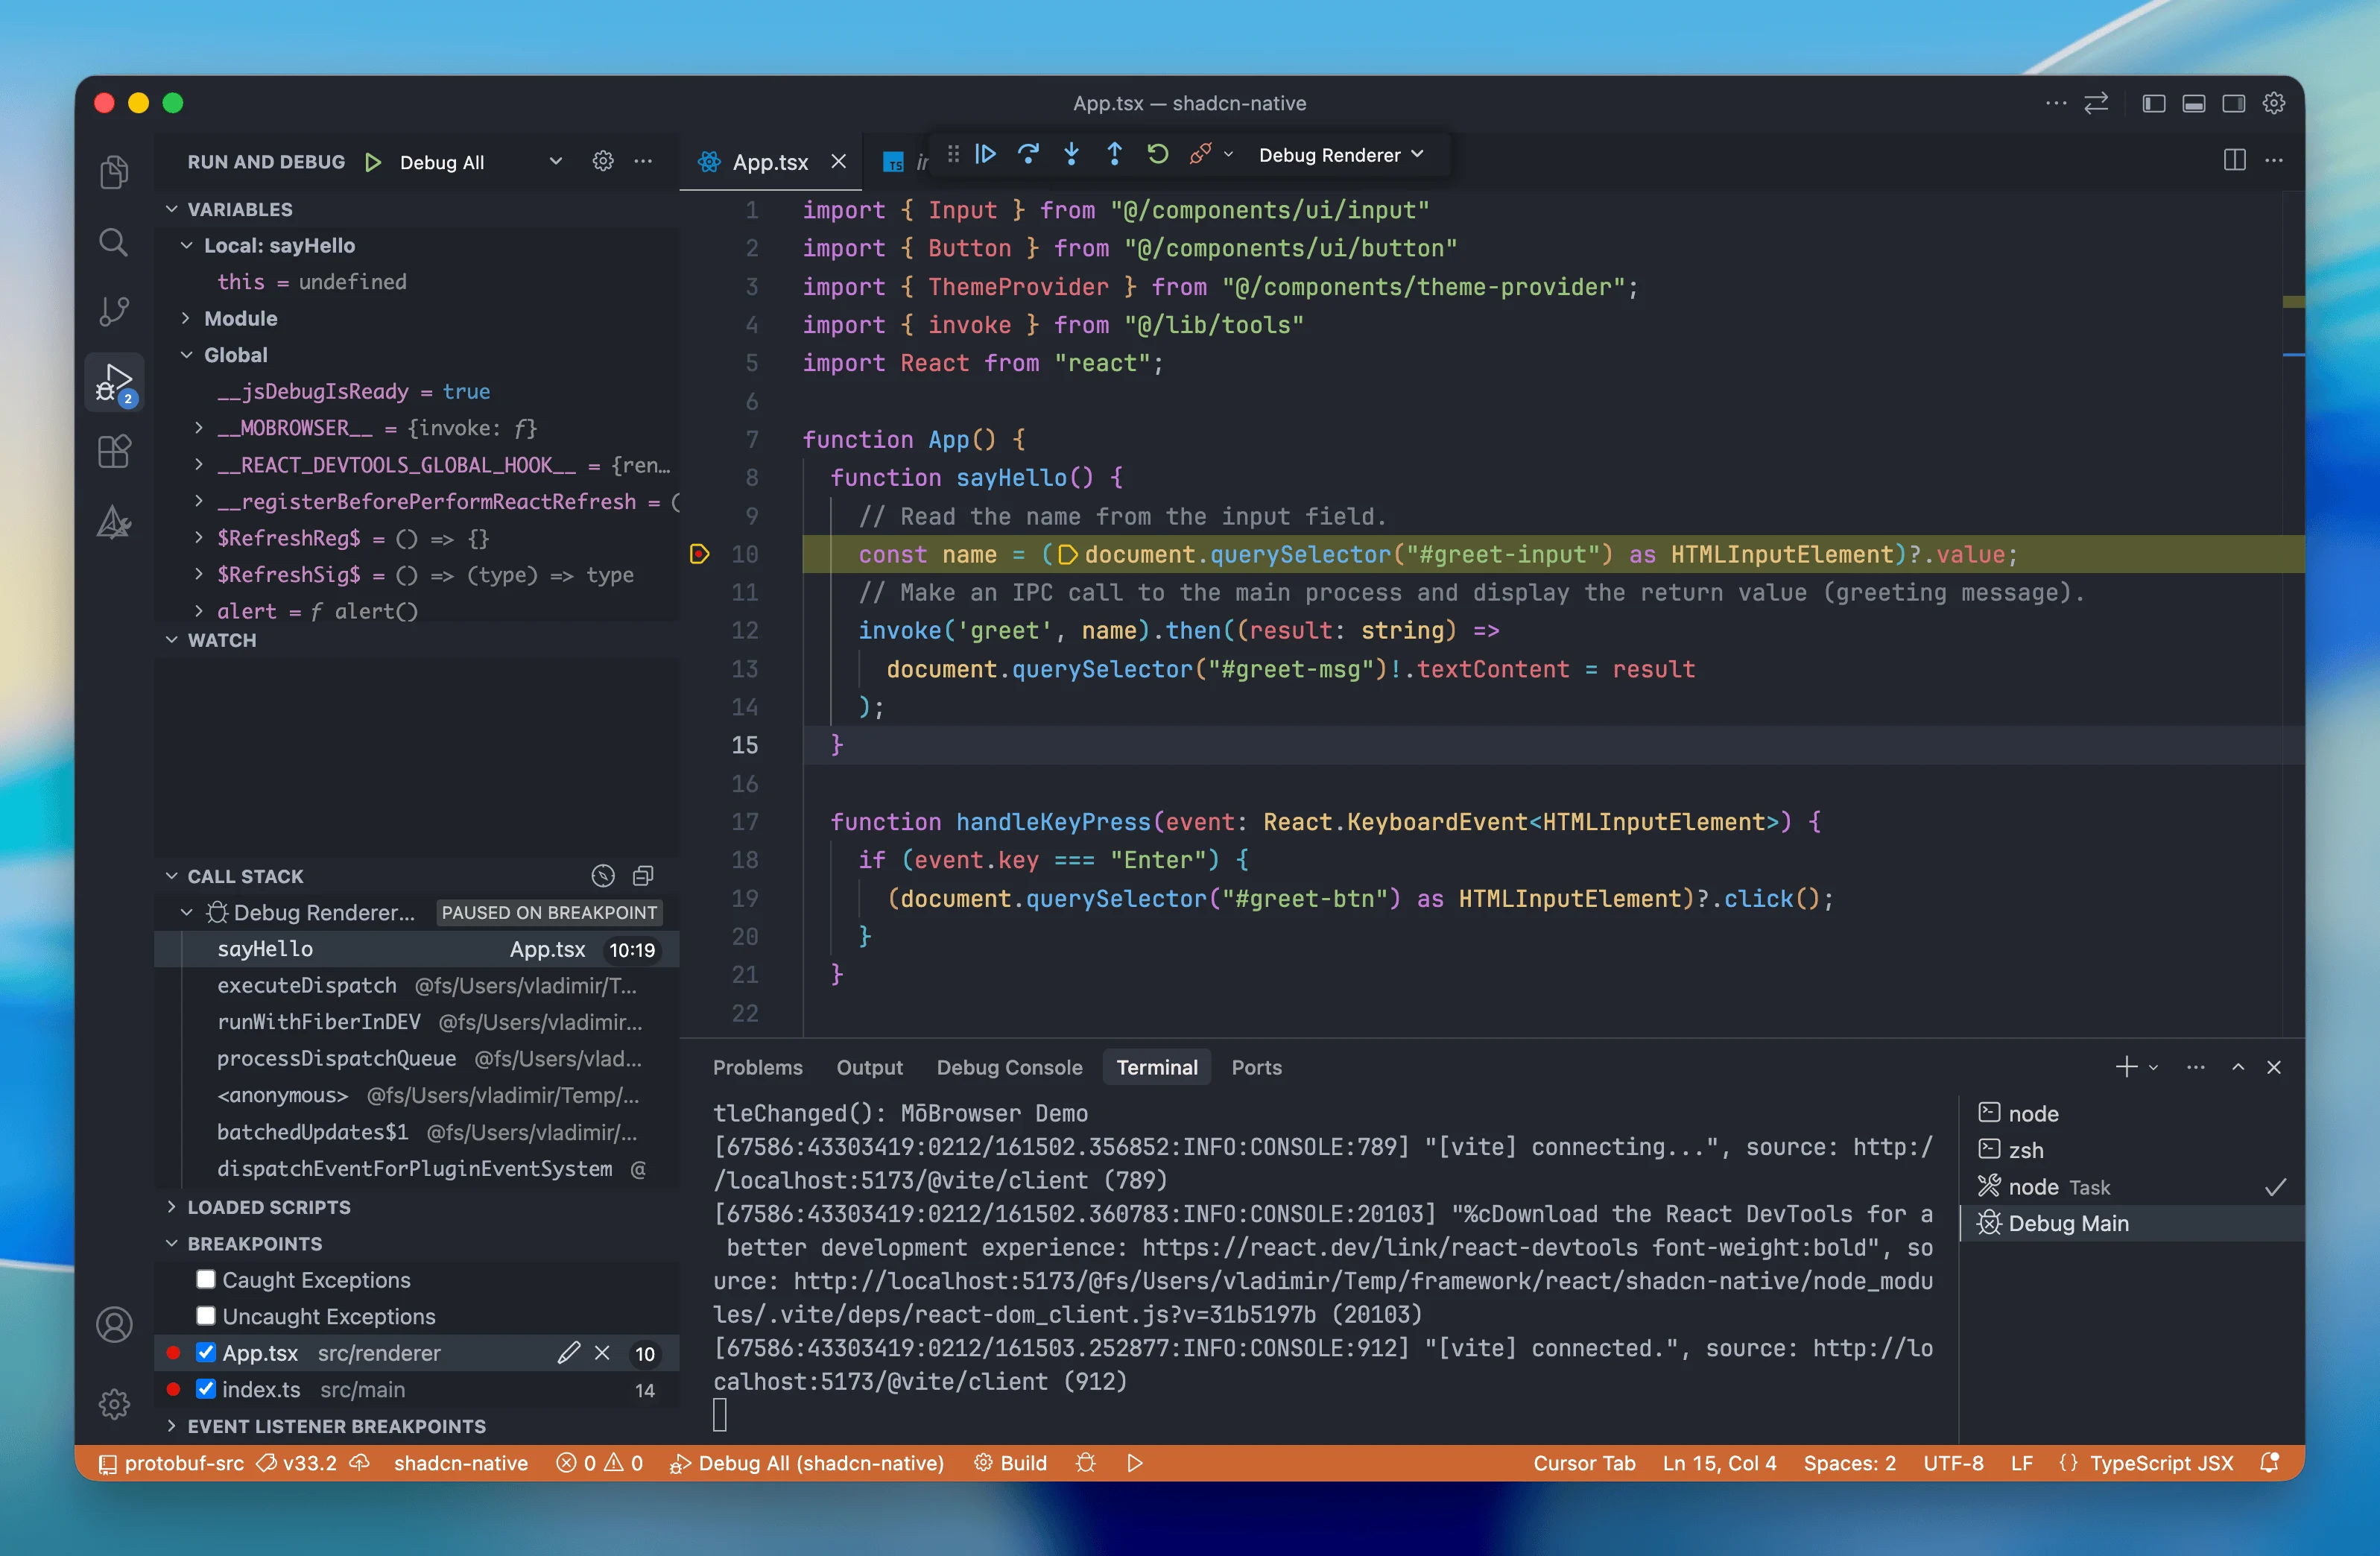
You should be able to hit the breakpoints and inspect the variables and call stack.
DevTools
The Chromium DevTools is a powerful debugging tool that allows you to log messages, inspect JavaScript objects, and run JavaScript code in the context of your application.
To toggle the DevTools window you can add the corresponding standard menu item to your application main or context menu and then use it, or you can programmatically show the DevTools window when the application is running in development mode:
import { app, BrowserWindow } from '@mobrowser/api';

const win = new BrowserWindow()
win.browser.loadUrl(app.url)
win.show()

// Open DevTools in development mode.
if (!app.packaged) {
  win.browser.devTools.open()
}
You should be able to see the DevTools window:
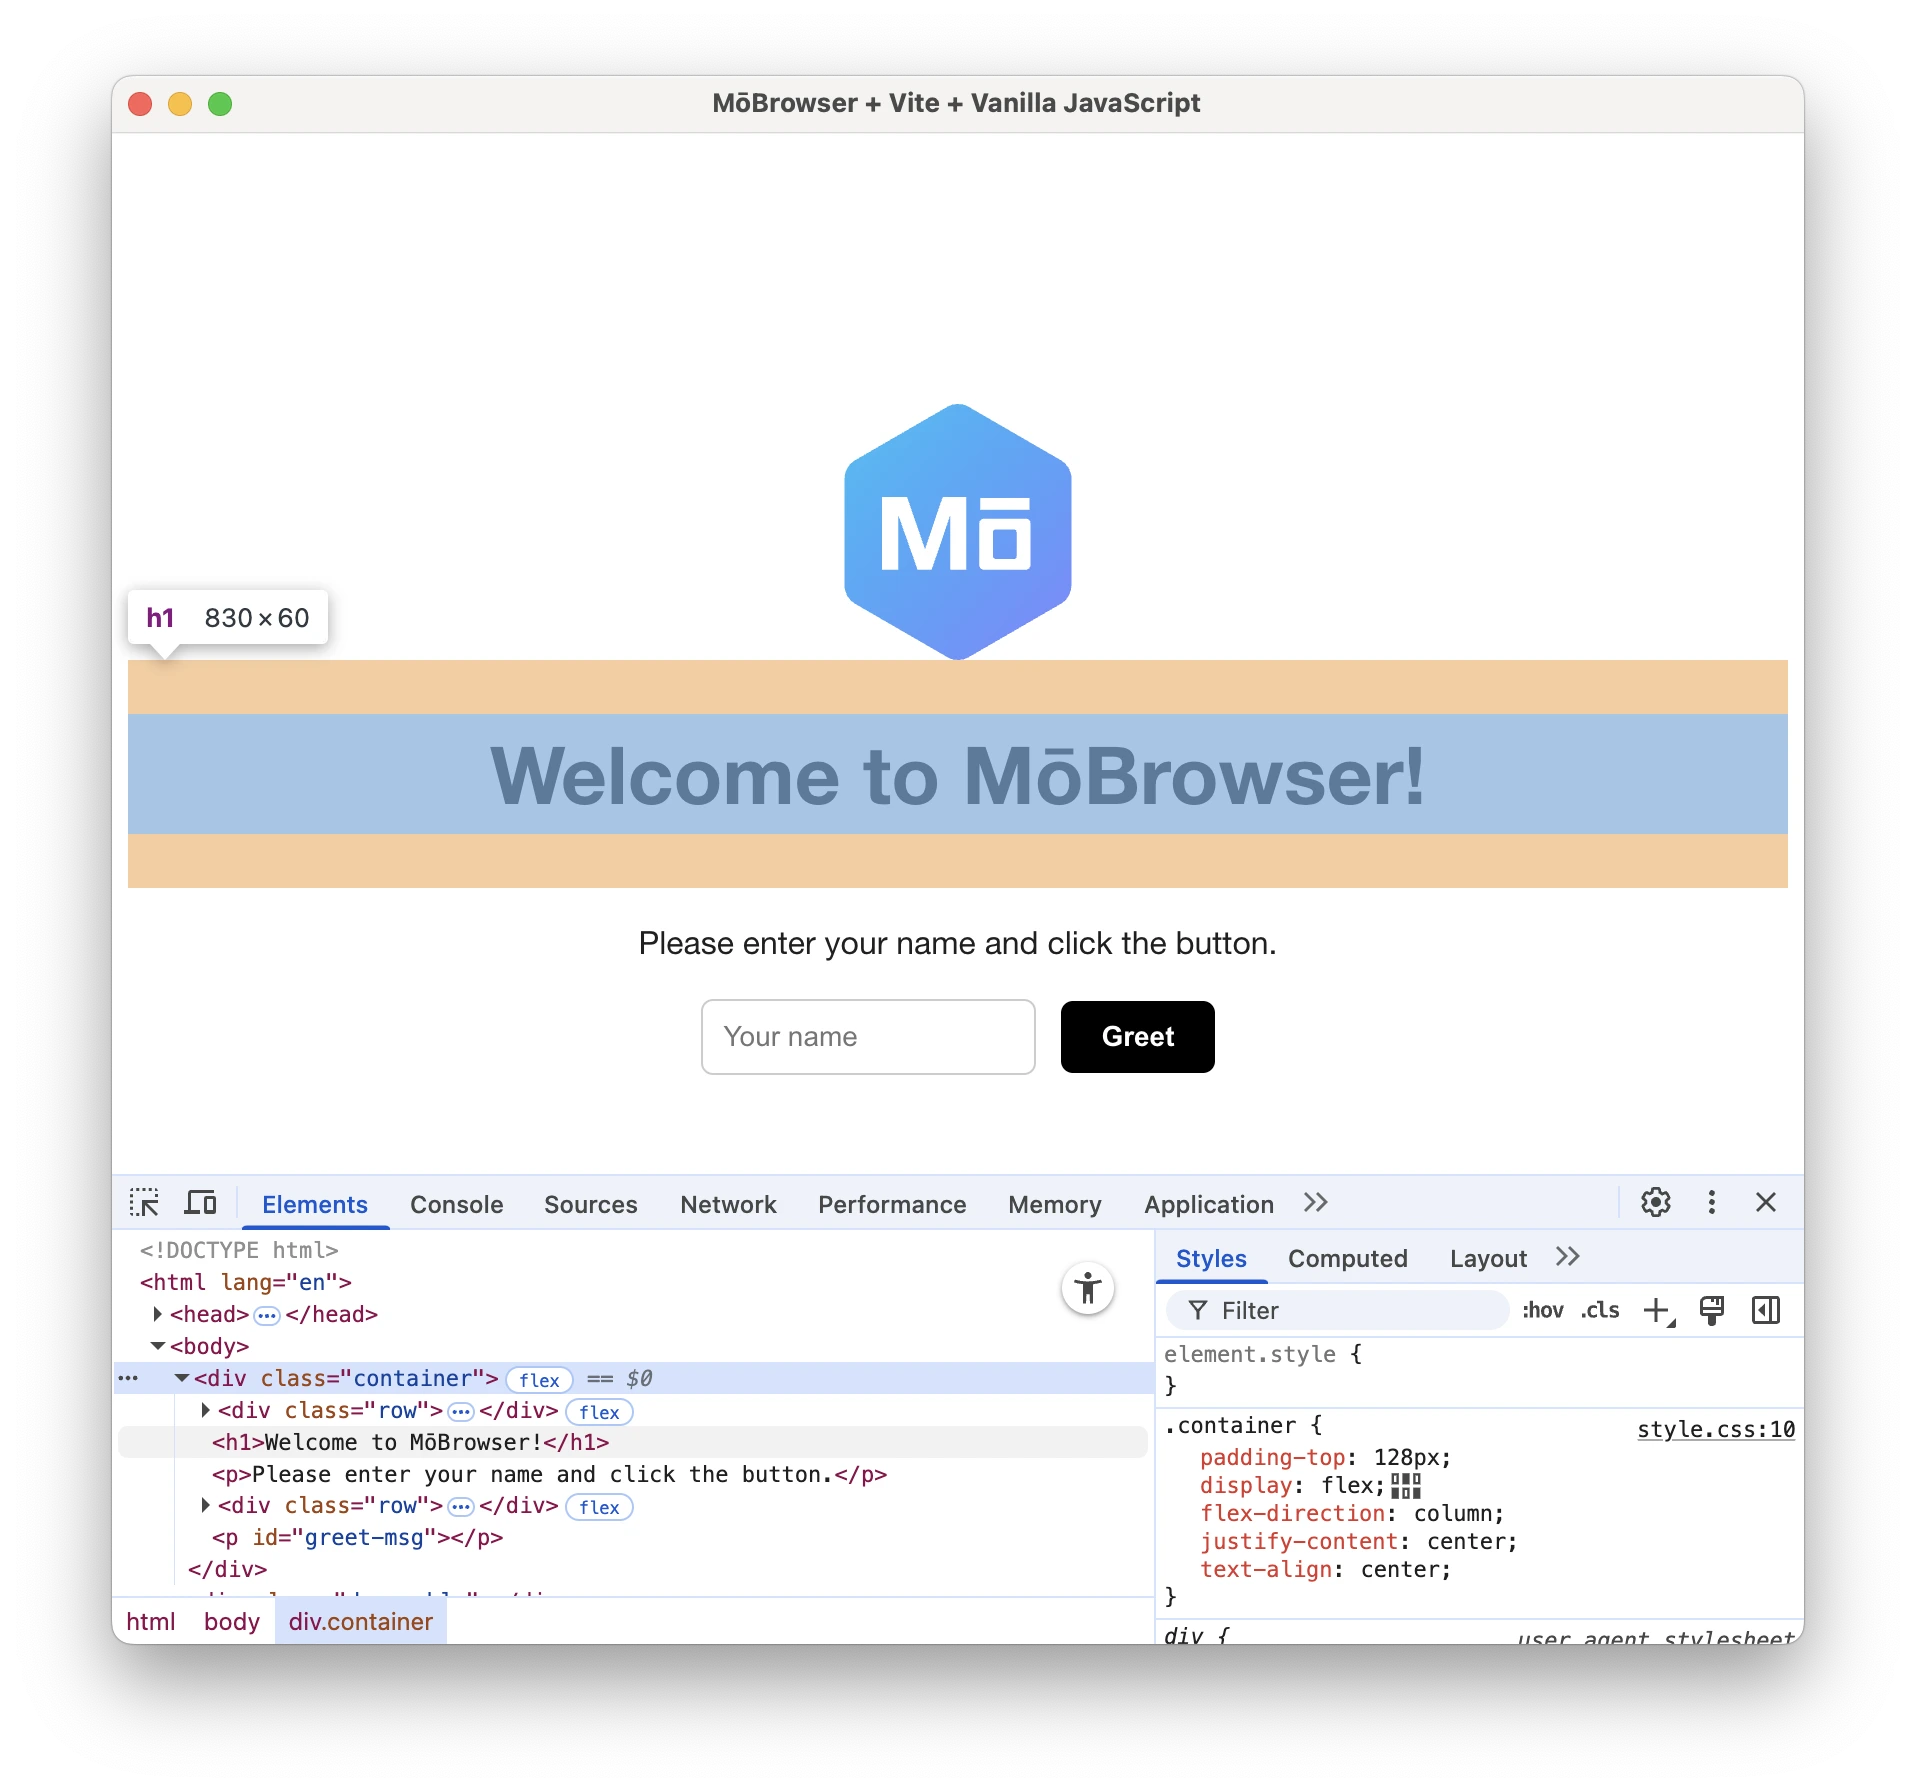
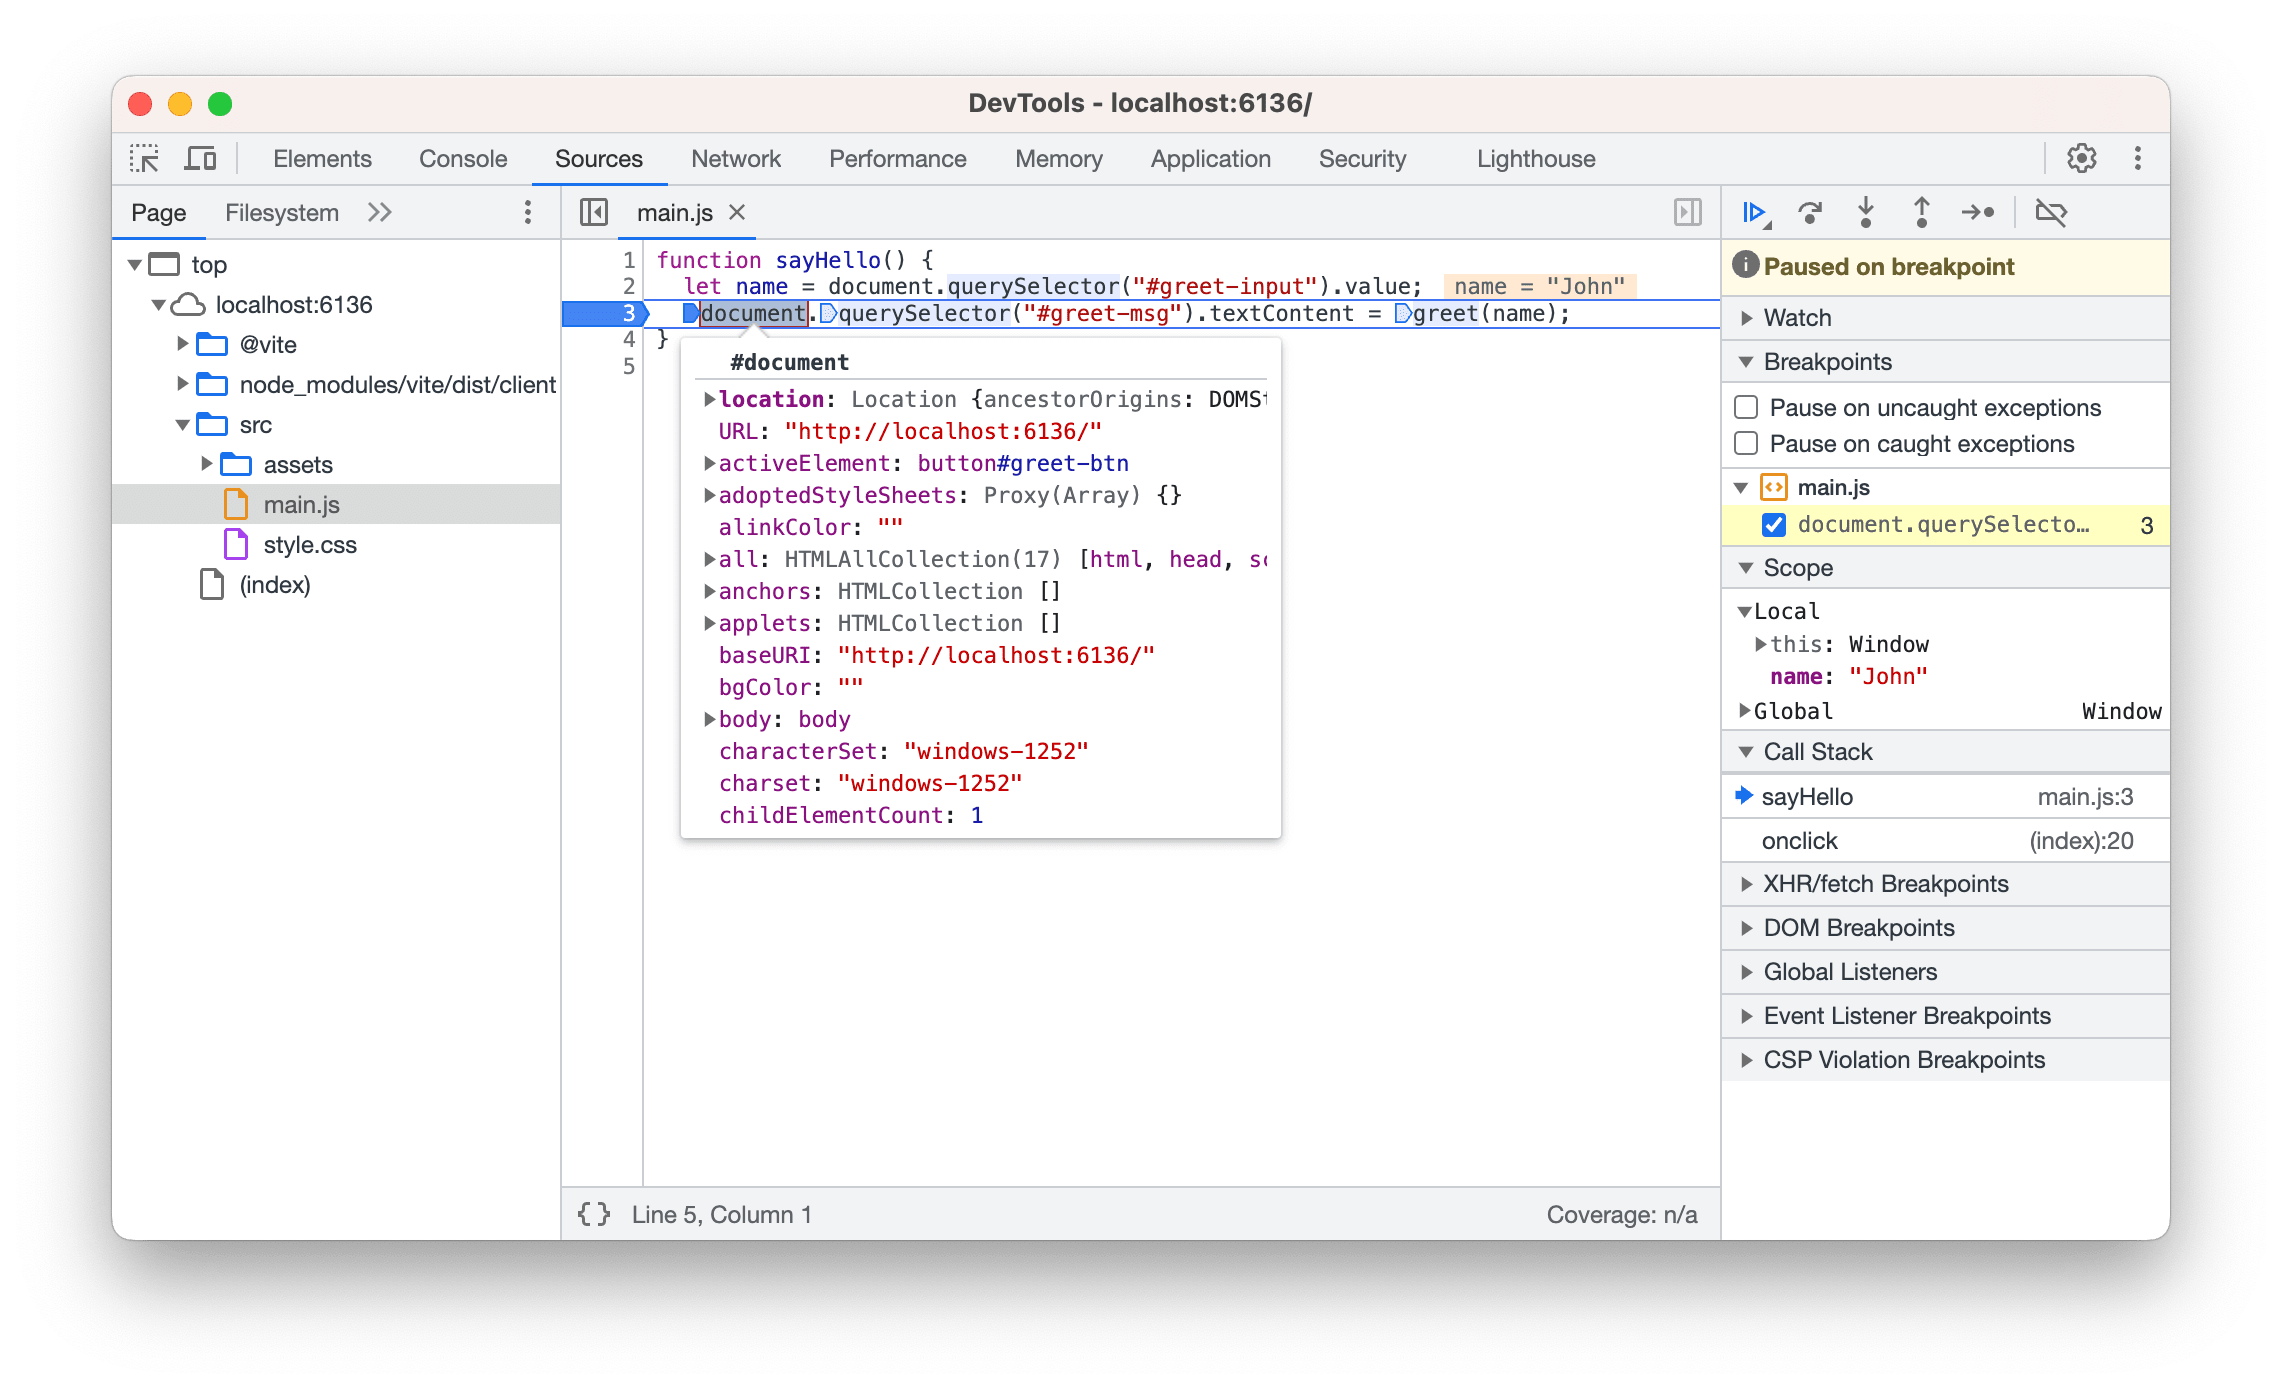
To debug JavaScript code in the DevTools window, open the Sources tab and select the JavaScript file you want to debug in the left sidebar. Then put breakpoints in the code by clicking the line number in the left sidebar.
Then reload content by pressing F5 or Ctrl+R on Windows and Linux and ⌘+Shift+R on macOS. Chromium DevTools will stop at the breakpoint:
TBD
- Restrict access to developer tools in production mode.
- Disable Command+Option+C shortcut in production mode.
Console
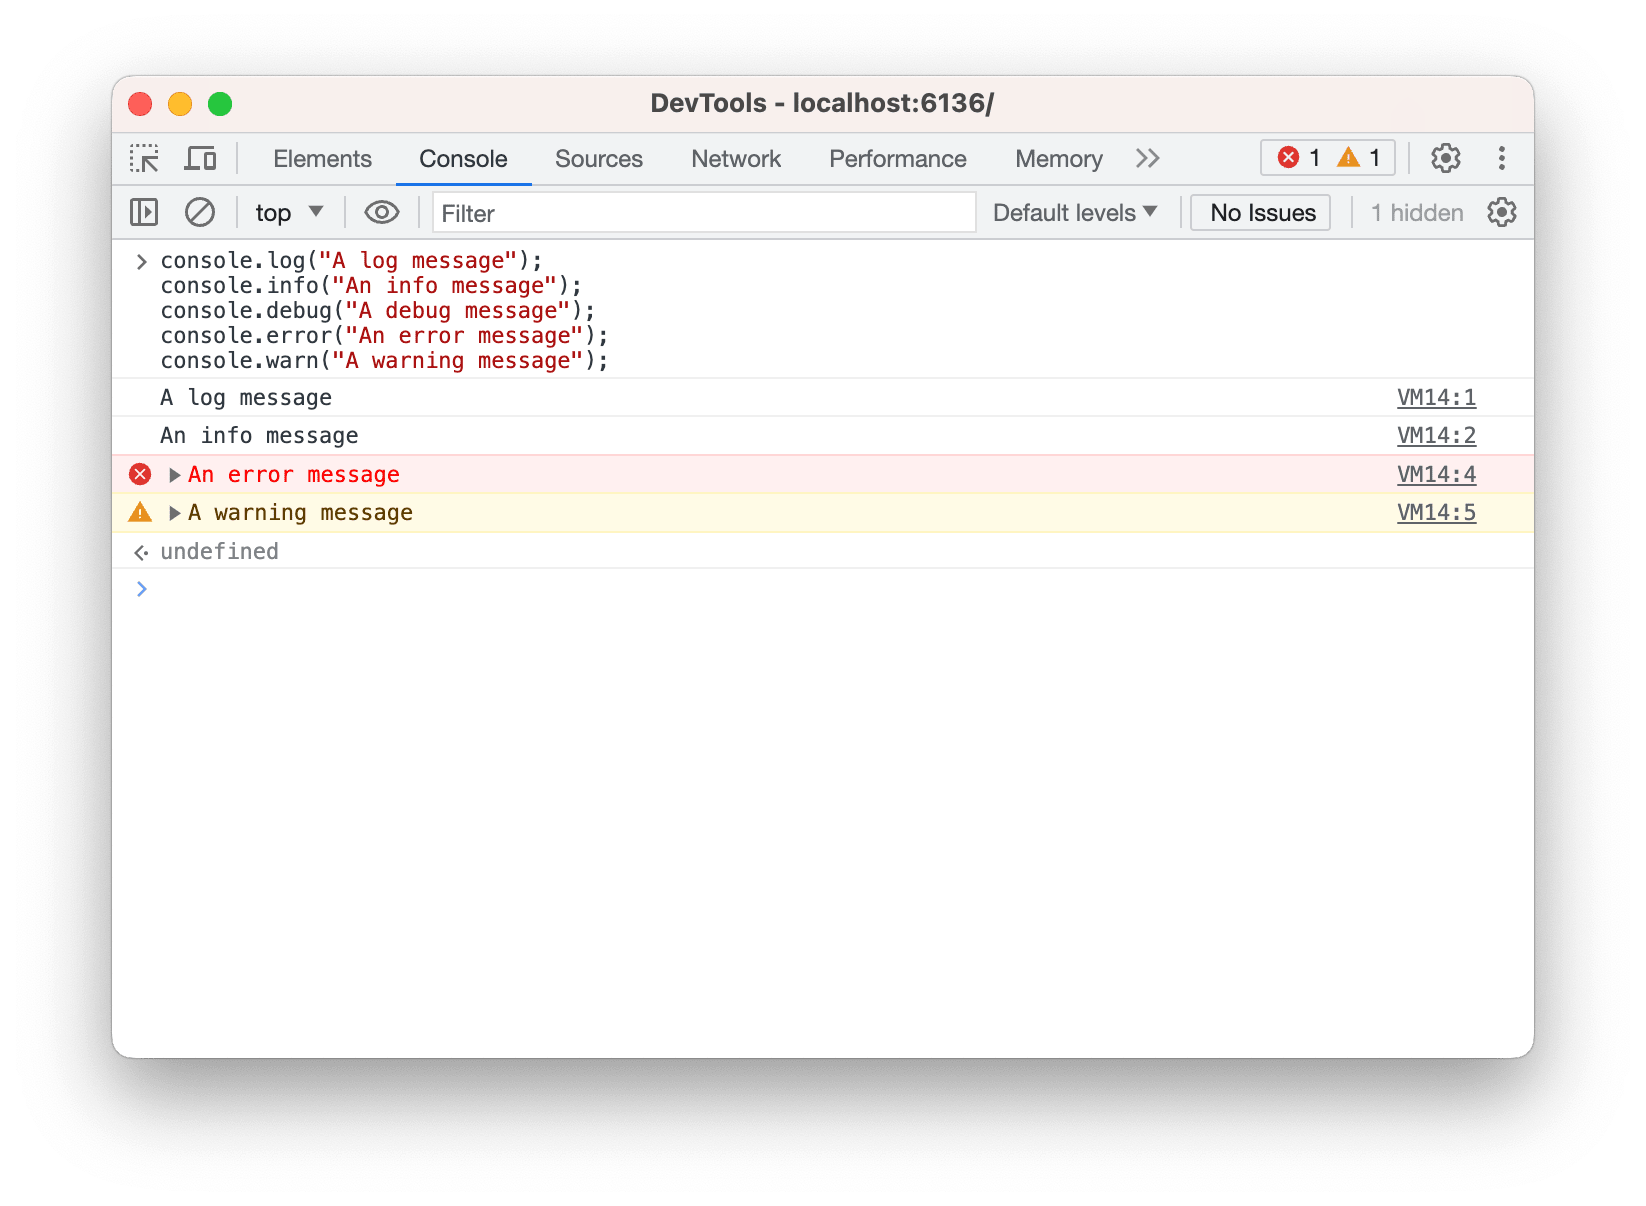
During debugging JavaScript code, you might want to use the Console API to write messages to the Chromium DevTools Console.
To log messages with different levels in JavaScript use the following approach:
console.log("A log message");
console.info("An info message");
console.debug("A debug message");
console.error("An error message");
console.warn("A warning message");
The messages will be displayed in the Chromium DevTools Console.